NFL Defenses Disguise Their Coverage on a Third of Dropbacks. We Couldn't Find the Payoff.
We measured how often each defense shows one safety picture at the snap and plays another, on 4,932 tracked dropbacks from weeks 1 to 6 of the 2024 season. Buffalo and the Rams do it twice as often as Dallas, and it's a stable habit. What it buys the defense is much harder to find.
By Advanced Football StatsPublished 9 min read
You hear it every Sunday: "they showed two-high and spun it," or "he's rotating late." Disguise is the part of pass defense everybody talks about and nobody counts. So we counted it.
Quarterbacks read the safeties before the snap. Two deep defenders split across the field usually means the middle is open: cover 2, quarters, 2-man. One deep defender in the middle usually means it's closed: cover 1 or cover 3. Defenses know that, so they lie. A safety walks down at the snap, or a single-high safety bails to half the field, and the picture the quarterback read is gone.
The coverage a defense plays is charted for every play. What it showed before the snap isn't. We measured that from our own player tracking, compared it to the coverage that was actually played, and asked two questions: who disguises the most, and does it work?
The short version
- Defenses disguise on 36% of dropbacks. When the safeties show two deep, the defense plays one deep 44% of the time. When they show one deep, it opens up to two deep 27% of the time.
- It's a habit, not noise. A defense's rate in odd weeks predicts its rate in even weeks (correlation 0.68). Buffalo and the Rams disguise on about half their dropbacks; Dallas and Cleveland on about a fifth.
- We couldn't find a payoff. With the coverage held fixed (cover 3 disguised against cover 3 shown honestly), disguised snaps were no worse for the offense in expected points, pressure, sacks, turnovers or how deep the quarterback threw. If anything, quarterbacks completed a few more passes against them.
- Offenses can't be ranked on it. How much disguise an offense sees is just its schedule, and how much it costs an offense doesn't repeat from week to week.
- The safeties aren't the whole lie. Quarters coverage almost never looks like quarters before the snap, and that disguise lives in the corners and the box, not the safeties.
What a rotation looks like
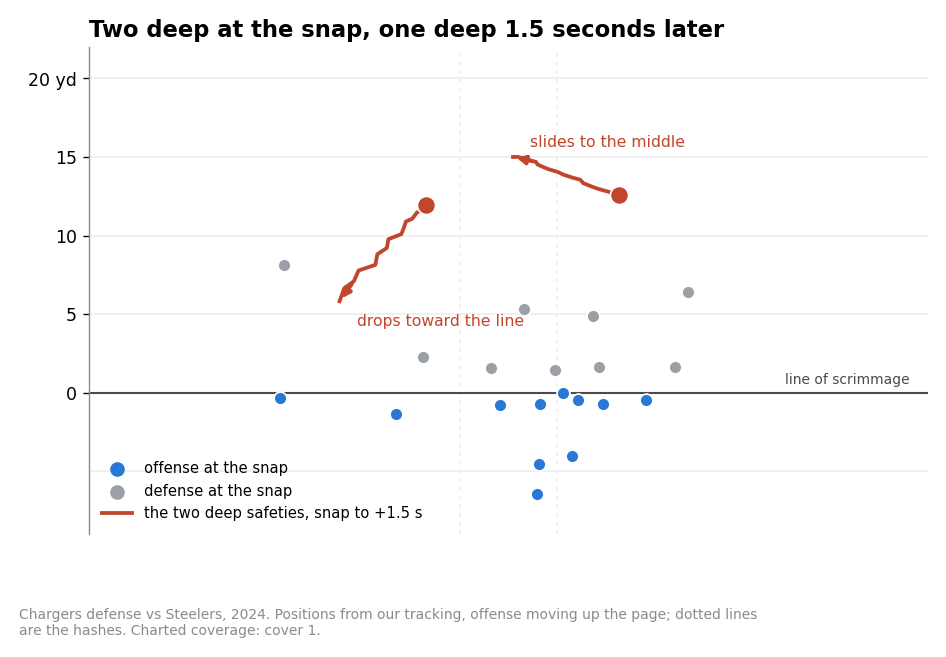
That's the textbook rotation: one safety comes down into the box or underneath, the other slides to the middle and becomes the single high safety. Across every two-high look that was played as one deep, the closer safety ends up a median 4.1 yards from the middle of the field 1.5 seconds after the snap, against 6.6 yards when the shell stays two deep.
How often defenses disguise
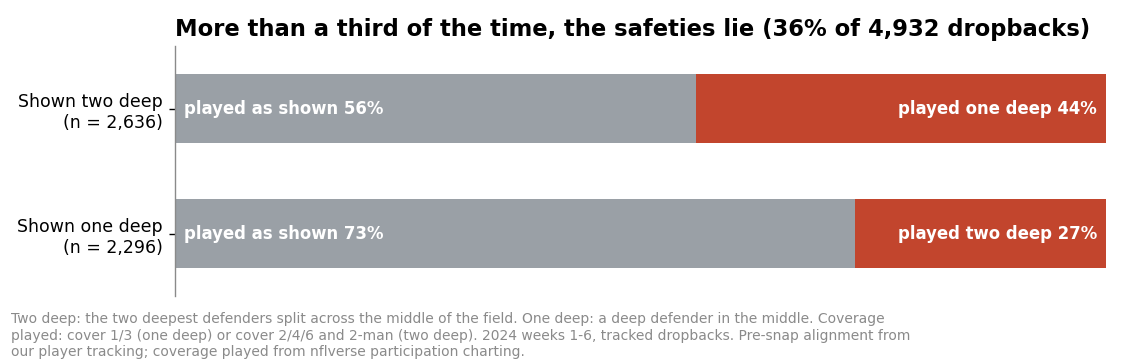
Two-high is the more common lie. That makes sense: it's easier to bring a safety down at the snap than to get one from the middle of the field out to a deep half in time.
It also fits where defenses start. They showed two deep on 53% of these dropbacks, a picture that takes the deep ball away before the snap. From there, the cheap way to change it is to drop one safety toward the line, where he also helps against the run.
Who disguises the most
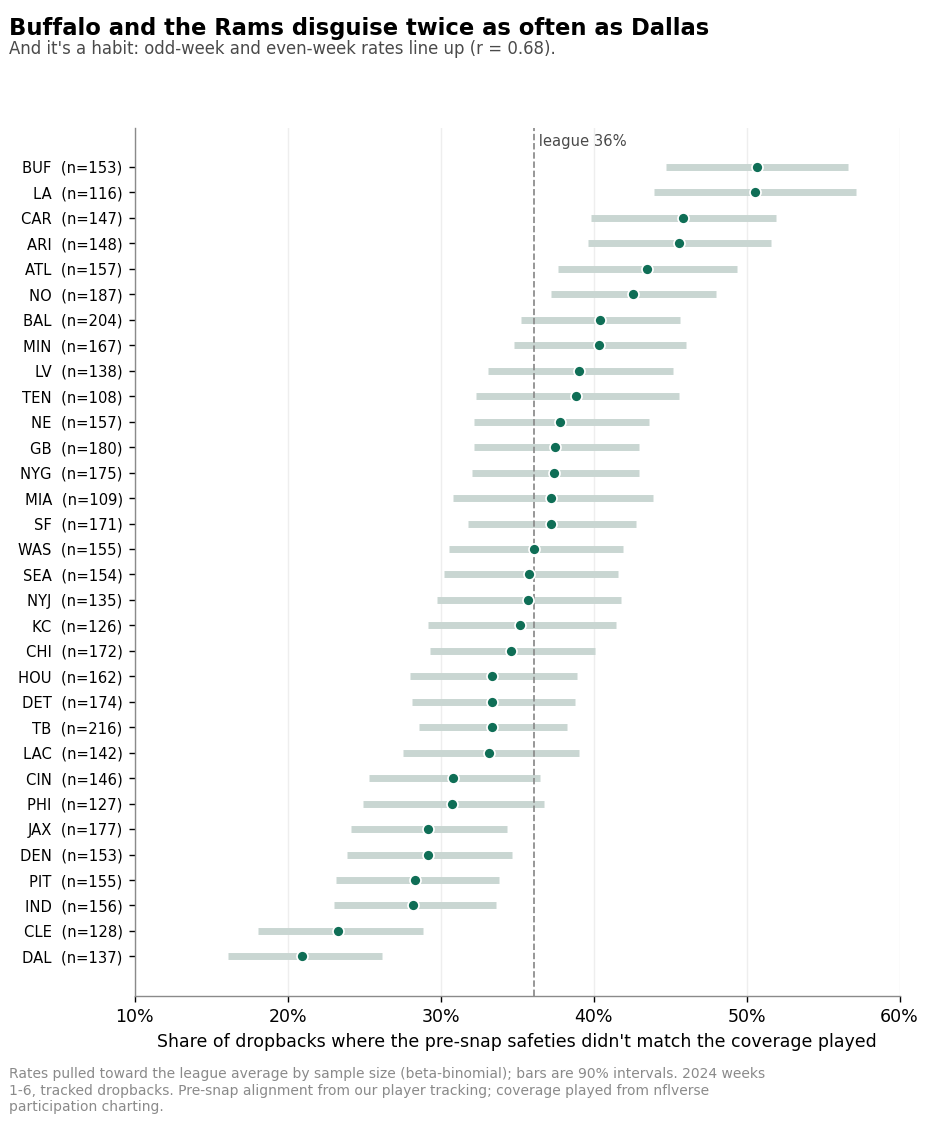
- Most: Buffalo (51%, 90% interval 45% to 57%) and the Rams (51%, 44% to 57%), then Carolina and Arizona (both 46%).
- Least: Dallas (21%, 16% to 26%) and Cleveland (23%, 18% to 29%), then Indianapolis and Pittsburgh (both 28%).
This is a real team trait. Split the six weeks into odd and even weeks, and the two rates line up across the 32 defenses with a correlation of 0.68. Most of what we measure from six weeks of tracking doesn't repeat that well.
Neither end of the list is a surprise. The Rams have run a version of Vic Fangio's defense since Brandon Staley brought it to Los Angeles in 2020, and that system starts from two deep safeties and changes the picture after the snap. Sean McDermott's Buffalo defenses have a long reputation for late safety movement. At the other end, Jim Schwartz's Cleveland defense is built around its front four, with a lot of straightforward man coverage behind it.
Does it work?
This is the part we expected to be easy. It wasn't.
The comparison has to hold the coverage fixed. Cover 1 and cover 3 lead to different results whether or not they're disguised, so we compare each coverage with itself: cover 3 shown as two-high against cover 3 shown as one-high, and so on. We also hold fixed the offense, the week, down, distance, the expected pass rate and the score.
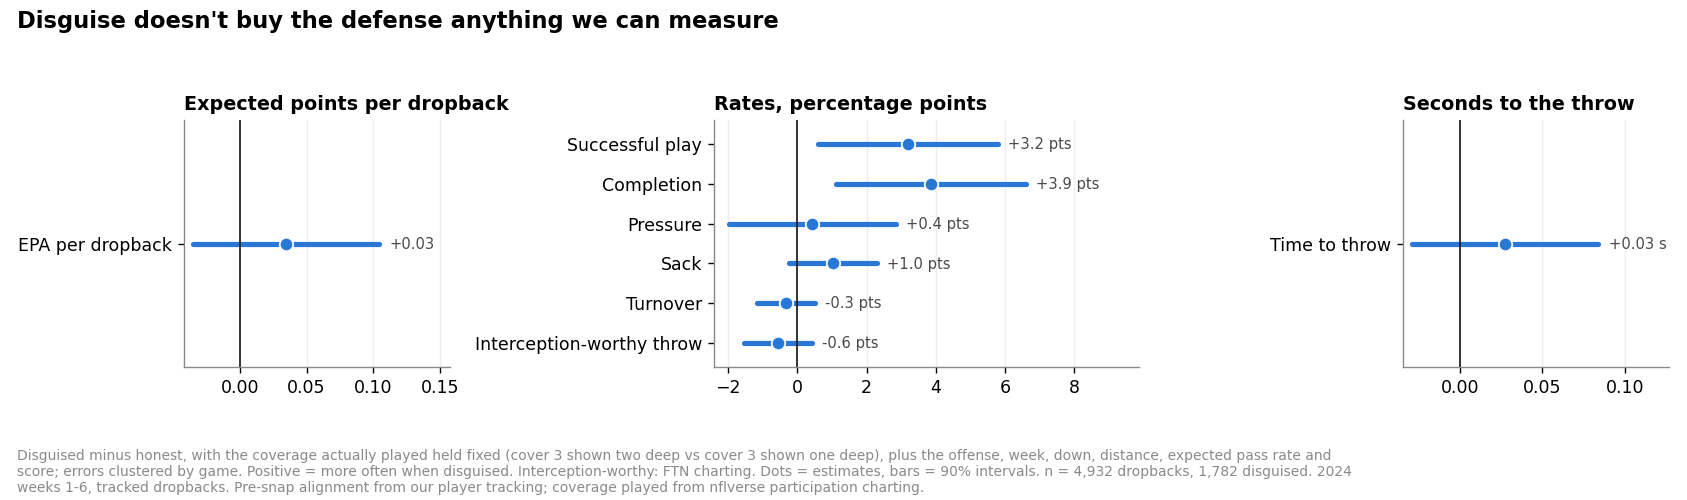
- Expected points: +0.03 per dropback for the offense, within noise.
- Pressure, sacks, time to throw: no change. The quarterback isn't holding the ball longer.
- Turnovers: 2.9% of disguised snaps against 3.0% of honest ones. The interval rules out more than about half a point of extra turnovers. Interceptions and FTN's interception-worthy throws don't rise either.
- How deep the ball goes: no change, −0.2 air yards per throw (−0.8 to +0.3), and the mix of short, intermediate and deep throws barely moves.
- Completions and success rate lean toward the offense: +3.9 and +3.2 percentage points. They're the only results near the edge of noise, and we don't make much of them on their own.
We also split it by coverage, six coverages and eight outcomes, 48 comparisons in all. Nothing survives a correction for running that many tests. The pattern behind the completion lean is consistent, though: when a one-deep coverage (cover 1 or 3) is disguised as two deep, quarterbacks throw a little shorter, complete more and make fewer risky throws. That's what you'd expect if they take the underneath throw a two-high look seems to offer. It's a lead for a full season of data, not a finding.
Why no payoff might be the right answer
There's a good reason the honest and disguised snaps might come out even. If quarterbacks could trust the safeties, a defense that never disguised would be easy to beat, and its honest snaps would get worse. Disguise is what keeps the honest snaps honest. A defense mixing well should leave the quarterback unable to tell the two apart, and that's exactly what we see. So "disguise doesn't pay on the snaps it's used" doesn't mean disguise is worthless. It means its value is spread across every snap, and this comparison can't see it.
What would show it is the other side: whether defenses that disguise more are better overall, once everything else is accounted for. Six weeks and 32 teams is not enough to answer that.
The offense's side
We looked at it from the offense's chair too:
- How much disguise an offense sees is its schedule. Once the defenses it played are accounted for, the rate an offense faces doesn't repeat between odd and even weeks.
- Which offenses handle disguise best can't be ranked. Each offense sees about 55 disguised dropbacks in six weeks, and the cost per offense jumps around from week to week.
- Young quarterbacks aren't hurt more. Quarterbacks in their first or second season did no worse against disguise than veterans.
The safeties aren't the whole picture
Safeties are only part of the look. Corners play press or off, linebackers walk up or back, and a fourth defender can sit deep. So we built a model that predicts the coverage from everything at the snap, every defender's position and the situation, and tested it on games it hadn't seen.
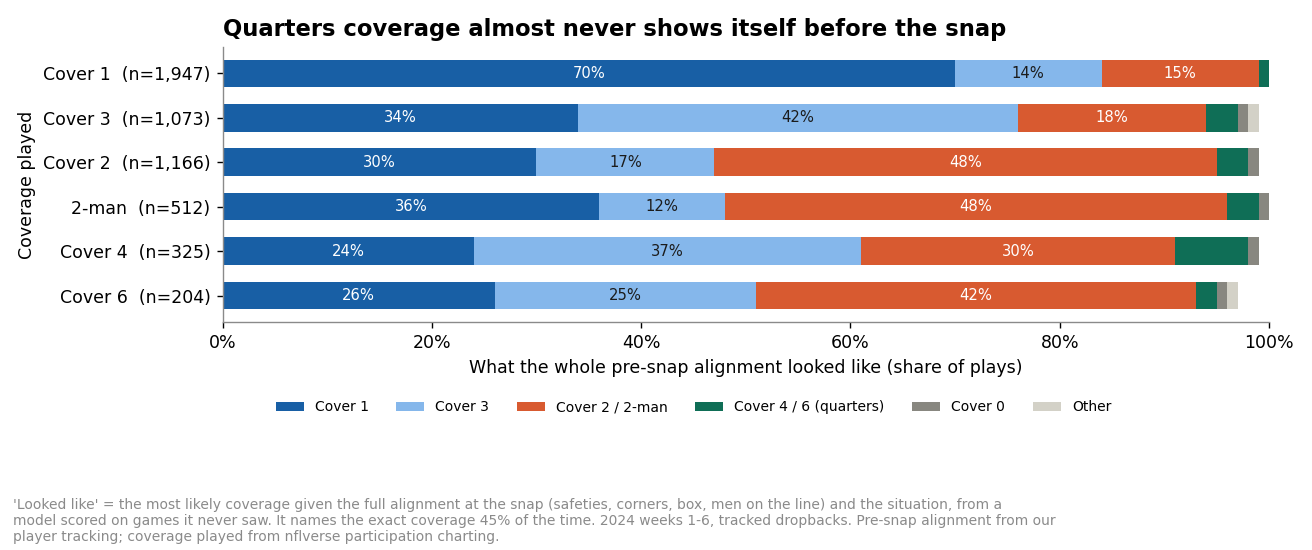
- The whole alignment says more than the safeties. It names the exact coverage 45% of the time, against 39% from the safeties alone and 35% from always guessing the league's most common coverage. Corners, the box and the third and fourth deep defenders add about two and a half times what the safeties add.
- Quarters is the best-kept secret. Before the snap, cover 4 looks like cover 3 or cover 2, and cover 6 looks like cover 2. It's almost never identified as quarters.
- "Hardest to read" isn't a team stat yet. The defenses with the least predictable pictures in odd weeks weren't the same ones in even weeks, and a less predictable picture didn't cost the offense anything we could measure.
We also checked whether outside corners lie with their alignment. The clearest case is a pressed corner who bails into zone: pressed corners played zone 27.5% of the time. Six weeks gives each defense too few chances to rank on it, and we found no payoff there either, so that one waits for more weeks.
The deep dive
What we measured
The pre-snap look comes from our tracking: each defender's position at the snap (the median of the nine frames before it), measured from the middle of the field, not the ball, because safeties split the field, not the hashes.
- Two-high: the two deepest defenders are on opposite sides of the middle, each 3 to 13 yards from it, the second at least 7 yards deep and within 5 yards of the first's depth.
- Single-high: one of the two is at least 10 yards deep and within 7 yards of the middle.
- Neither: 7% of dropbacks, left out.
Players behind the end lines or sidelines at the snap are dropped; that was 3 tracks on 2 plays.
The coverage played comes from FTN's charting, published in nflverse's participation data: cover 1 and 3 as one deep; cover 2, 4, 6 and 2-man as two deep. Cover 0 and unlabeled plays are left out of the comparison. That leaves 4,932 of 5,625 tracked dropbacks, 1,782 of them disguised.
Checking it by hand
We drew 30 plays at random that the rules had never been fitted on, and checked each against a diagram of the alignment. Every two-high and single-high call was right (19 of 19). The four misses were all plays the rules left out as "neither" that were really one-deep looks, so they cost sample, not accuracy.
We also moved each of the six cutoffs a yard either way. Across all 12 versions, the disguise rate stays between 35% and 37%, the odd-even correlation between 0.64 and 0.72, and the effect on expected points between +0.02 and +0.05, never distinguishable from zero.
The models
Effects are least-squares differences with fixed effects for the coverage played, the offense and the week, plus down, log of yards to go, the expected pass rate and the score. Standard errors are clustered by game. Adding defense fixed effects, so each defense is compared only with itself, doesn't change the results. Team rates are beta-binomial, pulled toward the league average by sample size, with 90% intervals. The whole-alignment model is gradient-boosted trees, scored out of fold with whole games held out.
What didn't hold up
An earlier version of the look rules, stricter about what counted as two-high, suggested disguise worked when the offense didn't use pre-snap motion and stopped working when it did. It didn't survive the corrected rules. It came from which plays the strict version happened to keep, so we've dropped it.
Limits
- "At the snap," not "before the snap." A defense that shows one picture at the line and rotates before the ball is snapped looks honest to us. We measure only the last look the quarterback gets.
- Six weeks of 2024. The team rates are solid; everything finer (by coverage, by offense, corners) needs more weeks.
- Charted coverage is the truth here. If the charting is wrong on a play, so are we.
- The payoff comparison is within snaps, not across defenses. It can't see the value disguise adds to the honest snaps (see above).
More weeks will tell us whether the completion lean and the corner disguises are real. We now run a version of this measure every week of the current season. This season's charting isn't published until the season ends, so it reads the safeties from tracking alone, at the snap and again 1.5 seconds later. Against the charting used here that read runs about a quarter lower, because a late rotation still looks two-high at 1.5 seconds. Through Week 10 the picture changed on about a quarter of dropbacks. The league numbers are free on our coverage page, and every defense's rate is there for Premium members.
Got a defense you want us to look at more closely? Send it our way.
Methods
Tracking: our own computer-vision pipeline on All-22 sideline video, 2024 regular season, weeks 1-6. Play-by-play and player IDs: nflverse (CC BY 4.0). Coverage charting, interception-worthy throws and pre-snap motion: FTN Data via nflverse (CC BY-SA 4.0).
Cite this: Advanced Football Stats, "NFL Defenses Disguise Their Coverage on a Third of Dropbacks. We Couldn't Find the Payoff.," November 18, 2026, https://advancedfootballstats.com/insights/nfl-coverage-disguise.