Pass Protection Ratings: Which Offensive Lines Buy Their Quarterback Time
Two new ratings built from player tracking, how much room each offensive line buys its quarterback and how often the pass rush gets there first, from 5,625 dropbacks in weeks 1 to 6 of the 2024 season. Plus what really drives pressure, from the quarterback's legs to the defenders on the field.
By Advanced Football StatsPublished
Sacks are a poor way to grade an offensive line. They are rare, a few per game, and many of them are the quarterback's doing: holding the ball, drifting into the rush, refusing to throw it away. With player tracking we can watch every dropback instead: how much room the line keeps around the quarterback, tenth of a second by tenth of a second, and how often the rush gets there before the ball is gone.
Today we're introducing two ratings built that way, the line rating and the pressure rating, plus a personnel-based rating of every pass rush. This first edition is built from 5,625 tracked dropbacks from weeks 1 to 6 of the 2024 season, and we tested the ratings on games the models hadn't seen.
The short version
- Offensive line ratings repeat. An offense's rating from earlier weeks predicted how much space it kept the following week, in all three weeks we tested (rank correlations of 0.59, 0.64 and 0.54).
- Space and pressure are not the same thing. How much room a line keeps and how often its quarterback gets pressured barely line up across offenses. Much of the difference is the quarterback's style: offenses whose quarterbacks scramble and run get pressured more than their line deserves, and so, to a lesser degree, do those whose quarterbacks hold the ball.
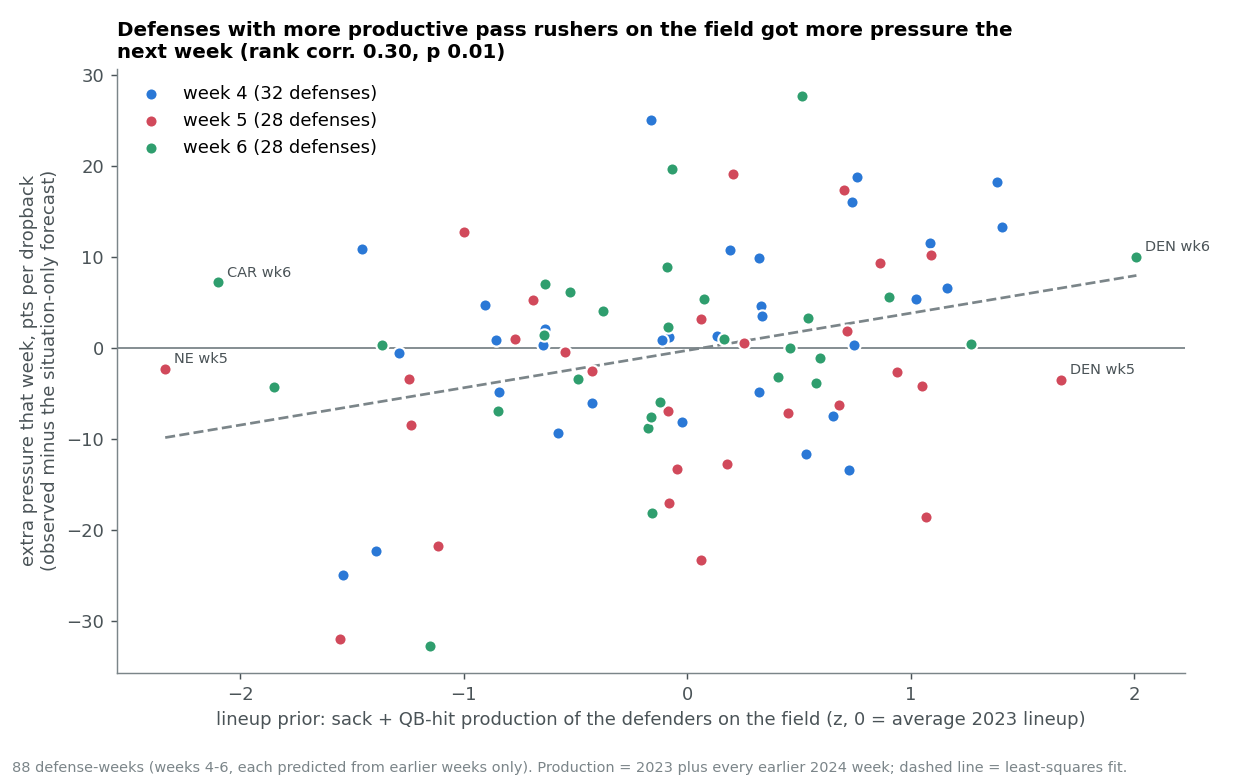
- A pass rush is its players. The best predictor of how much pressure a defense creates next week is the sack and QB-hit record of the players it puts on the field, not the defense's results so far.
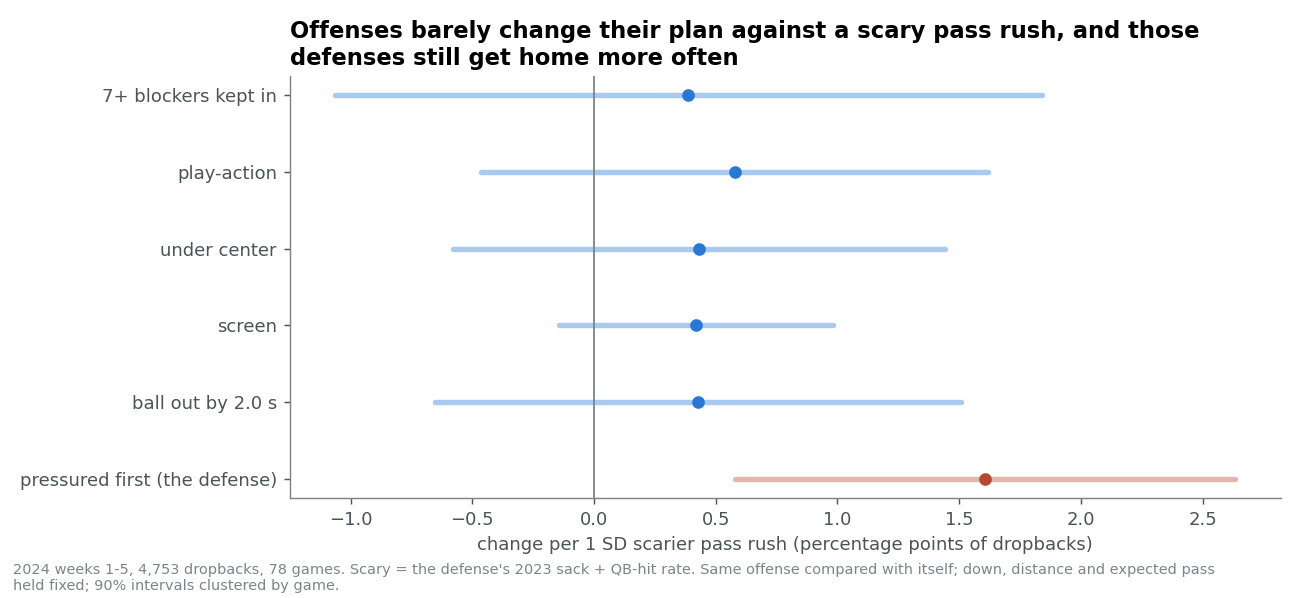
- Offenses don't change much against a scary front. They add a blocker slightly more often and throw no faster.
Every team is ranked below, with how sure we are about each rating. The models and the checks behind them are in the deep dive at the end.
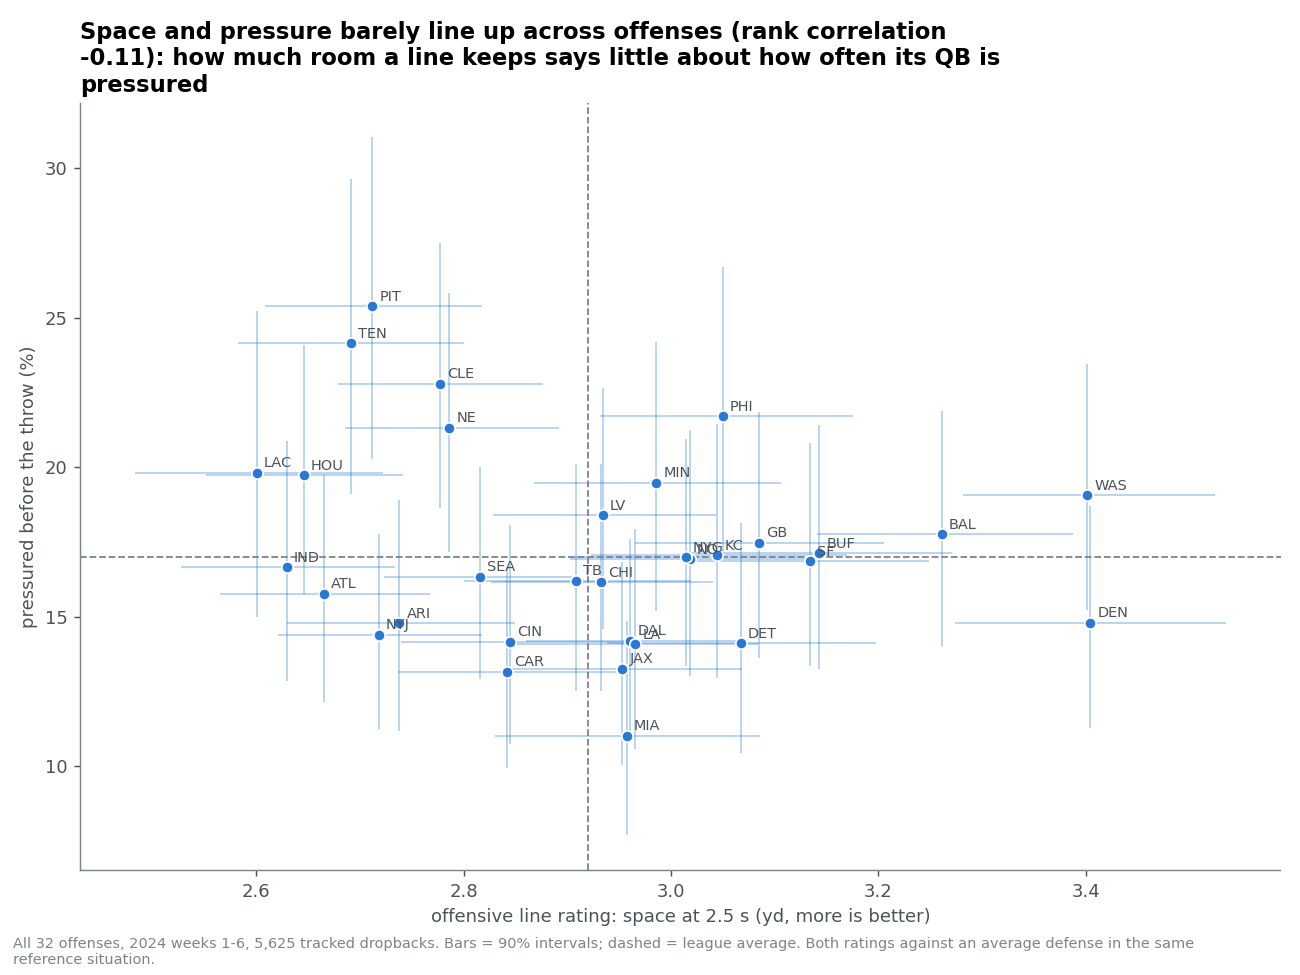
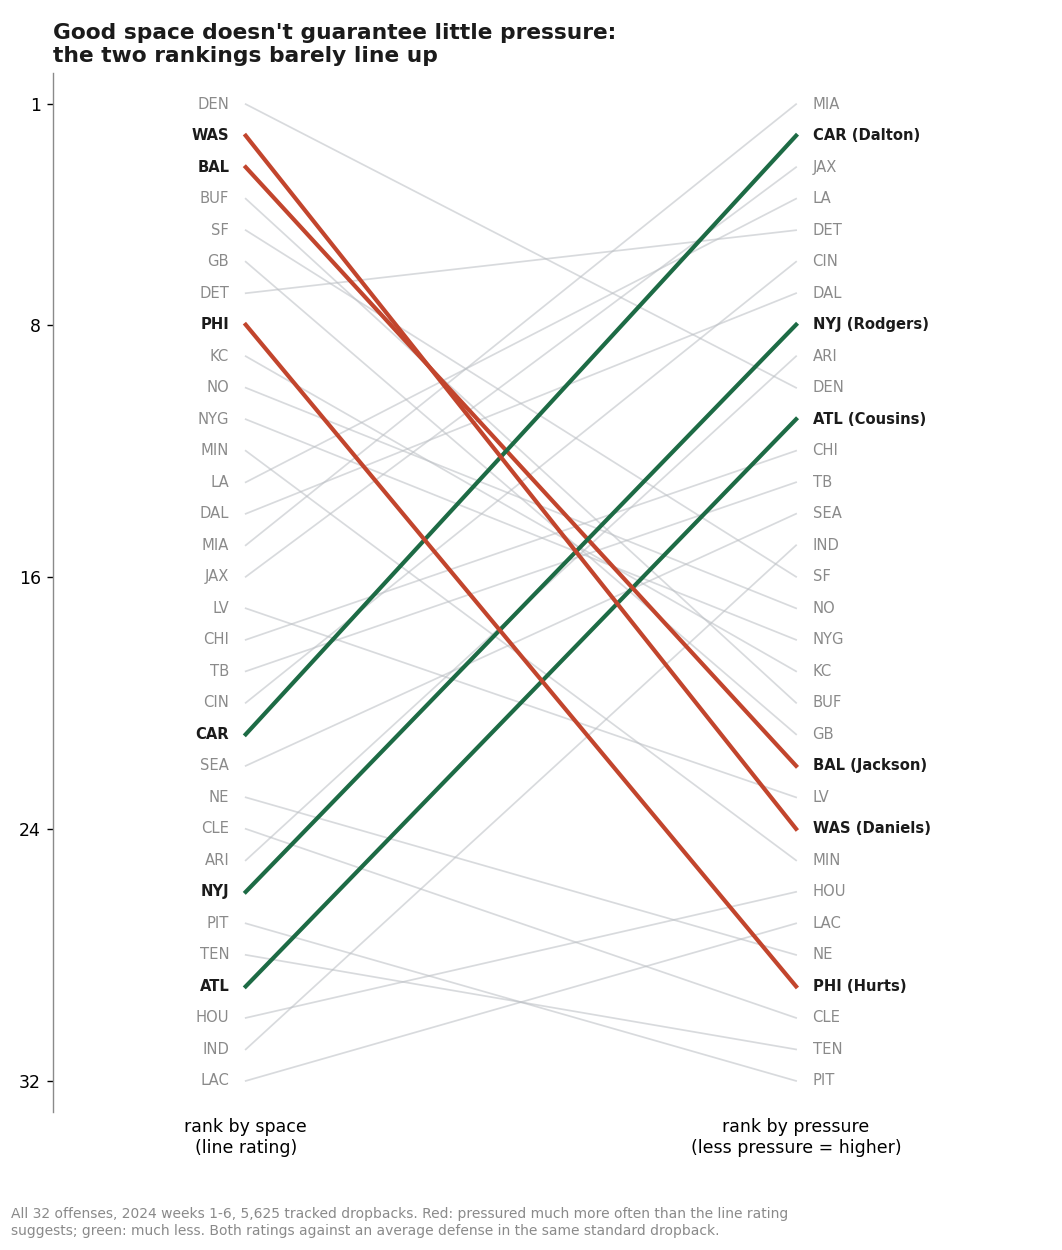
Look at the right side of the chart. Washington (Jayden Daniels), Baltimore (Lamar Jackson) and Philadelphia (Jalen Hurts) have three of the eight best lines by space, yet all three are pressured more often than average, Philadelphia clearly so. On the left, Carolina (mostly Andy Dalton, after Bryce Young's first two starts), Atlanta (Kirk Cousins) and the Jets (Aaron Rodgers) have weak lines by space and are pressured less than average.
Offensive line ratings
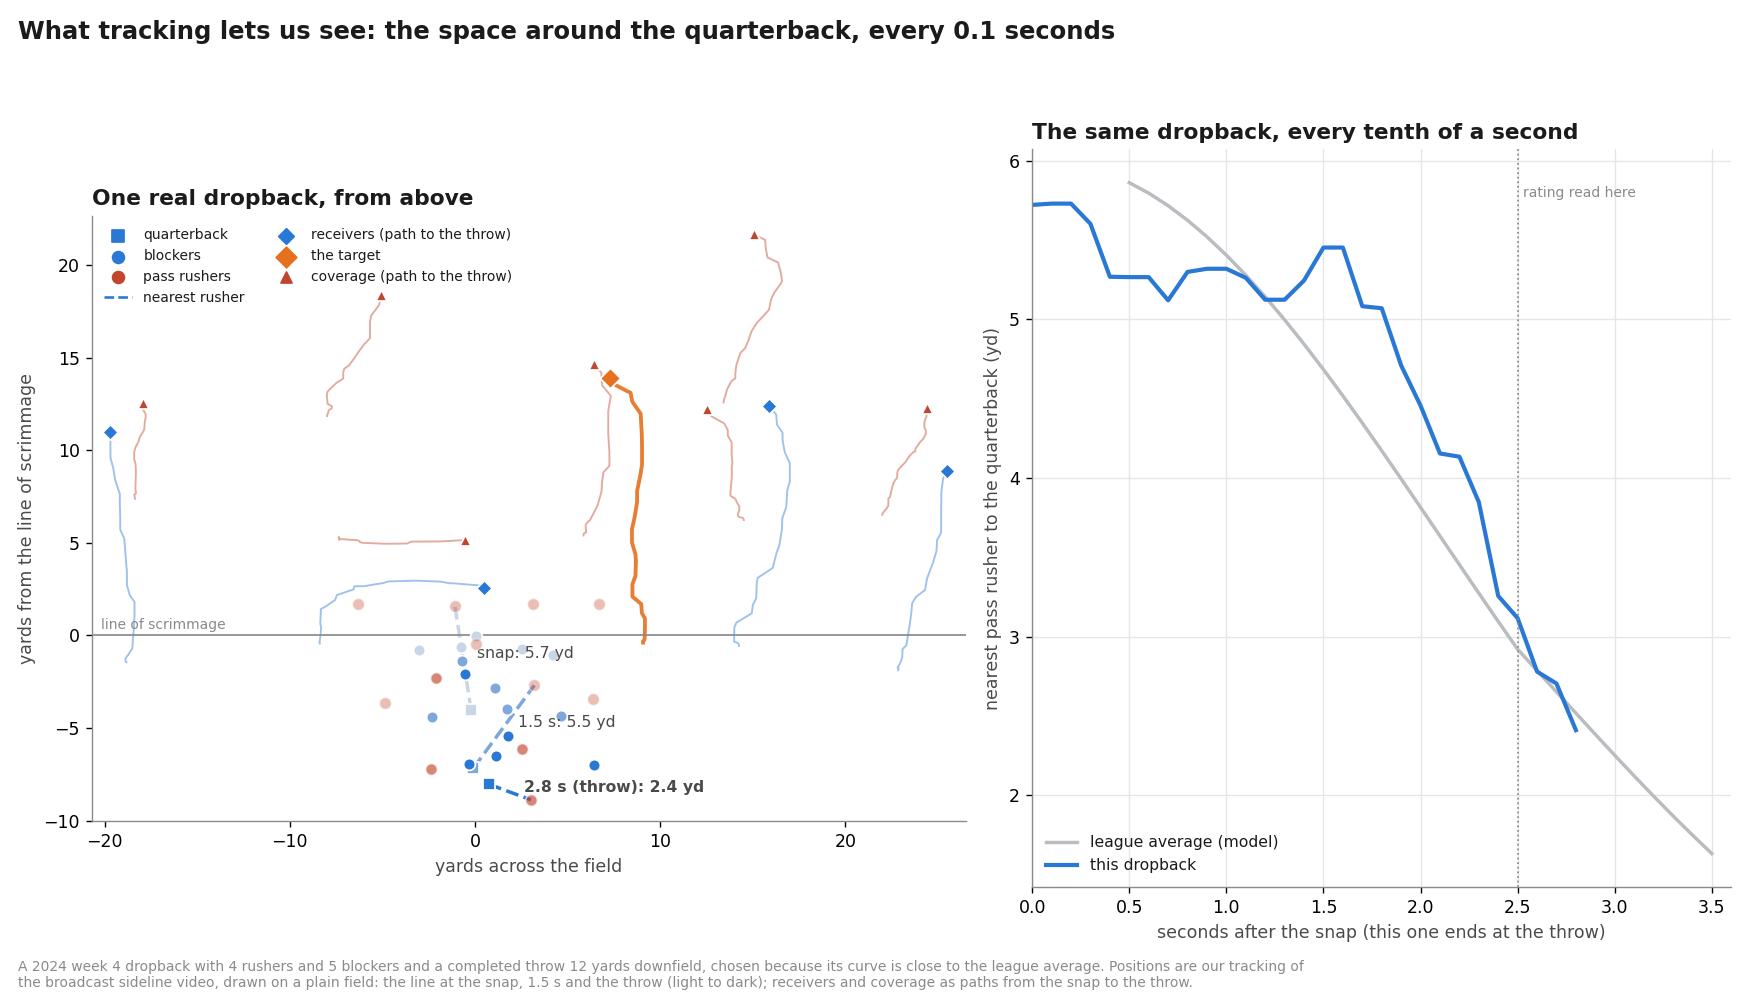
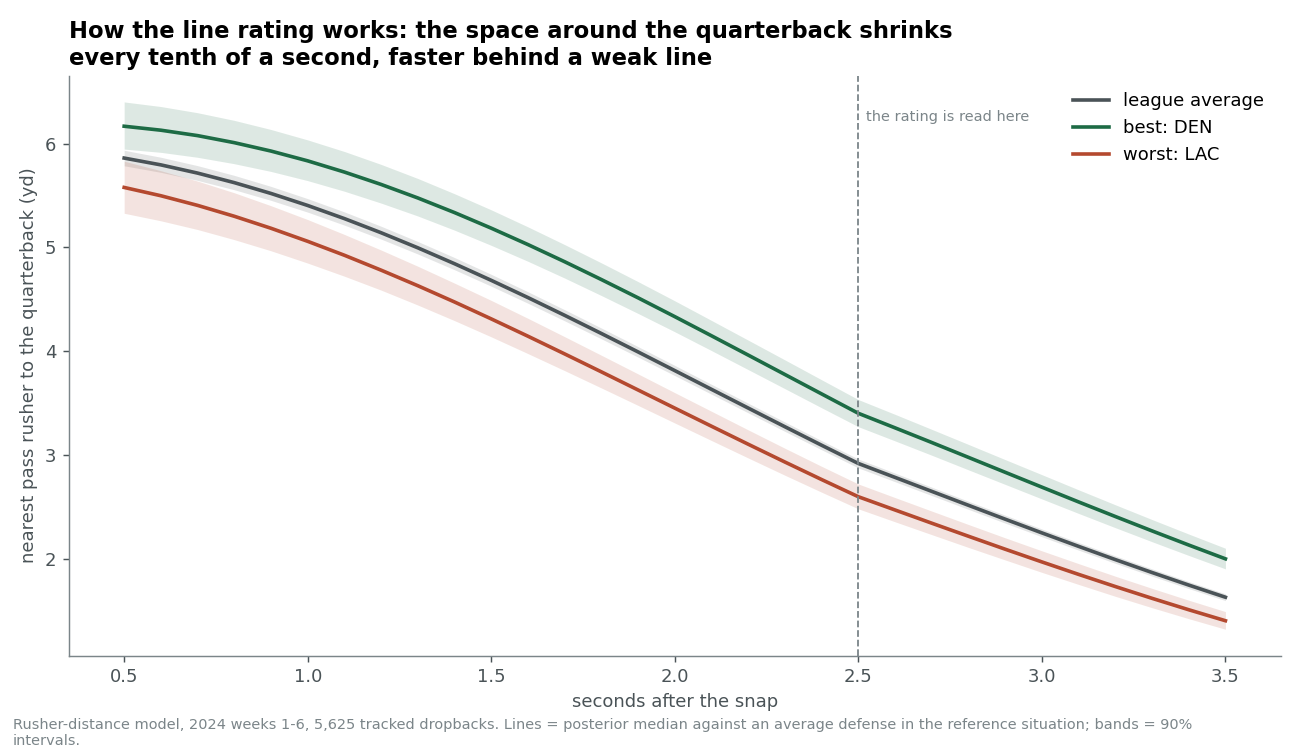
Every 0.1 seconds after the snap, we measure how far the nearest pass rusher is from the quarterback. The rating is that distance at 2.5 seconds, against an average defense in a standard dropback: four rushers, five blockers, shotgun, 1st or 2nd and 10. More space is better.
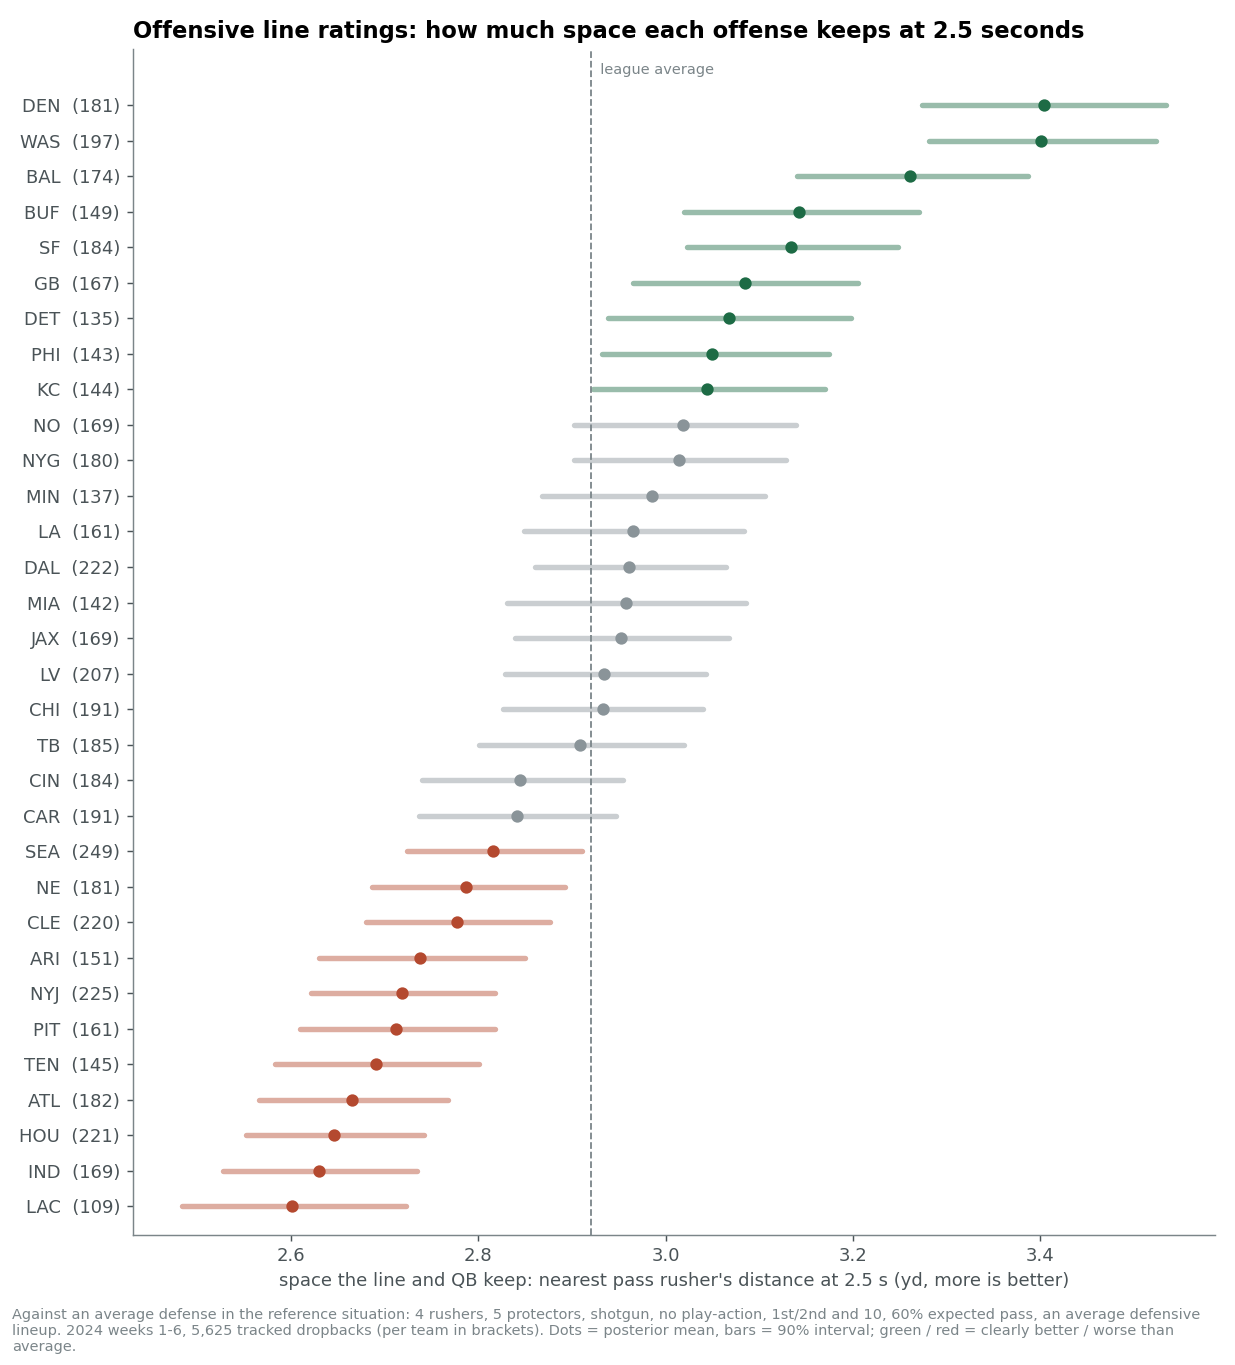
Denver and Washington lead, keeping the nearest rusher 3.4 yards away at 2.5 seconds, half a yard more than the league average of 2.9. Baltimore and Buffalo follow. At the bottom, the Chargers, Colts, Texans and Falcons keep about 2.6 to 2.7 yards. Nine offenses are clearly better than average and eleven clearly worse; the twelve in between can't be told apart from average after six weeks.
Offense pressure ratings
This rating asks a simpler question: how often does each offense get pressured before the ball is out? Same standard dropback, same average defense.
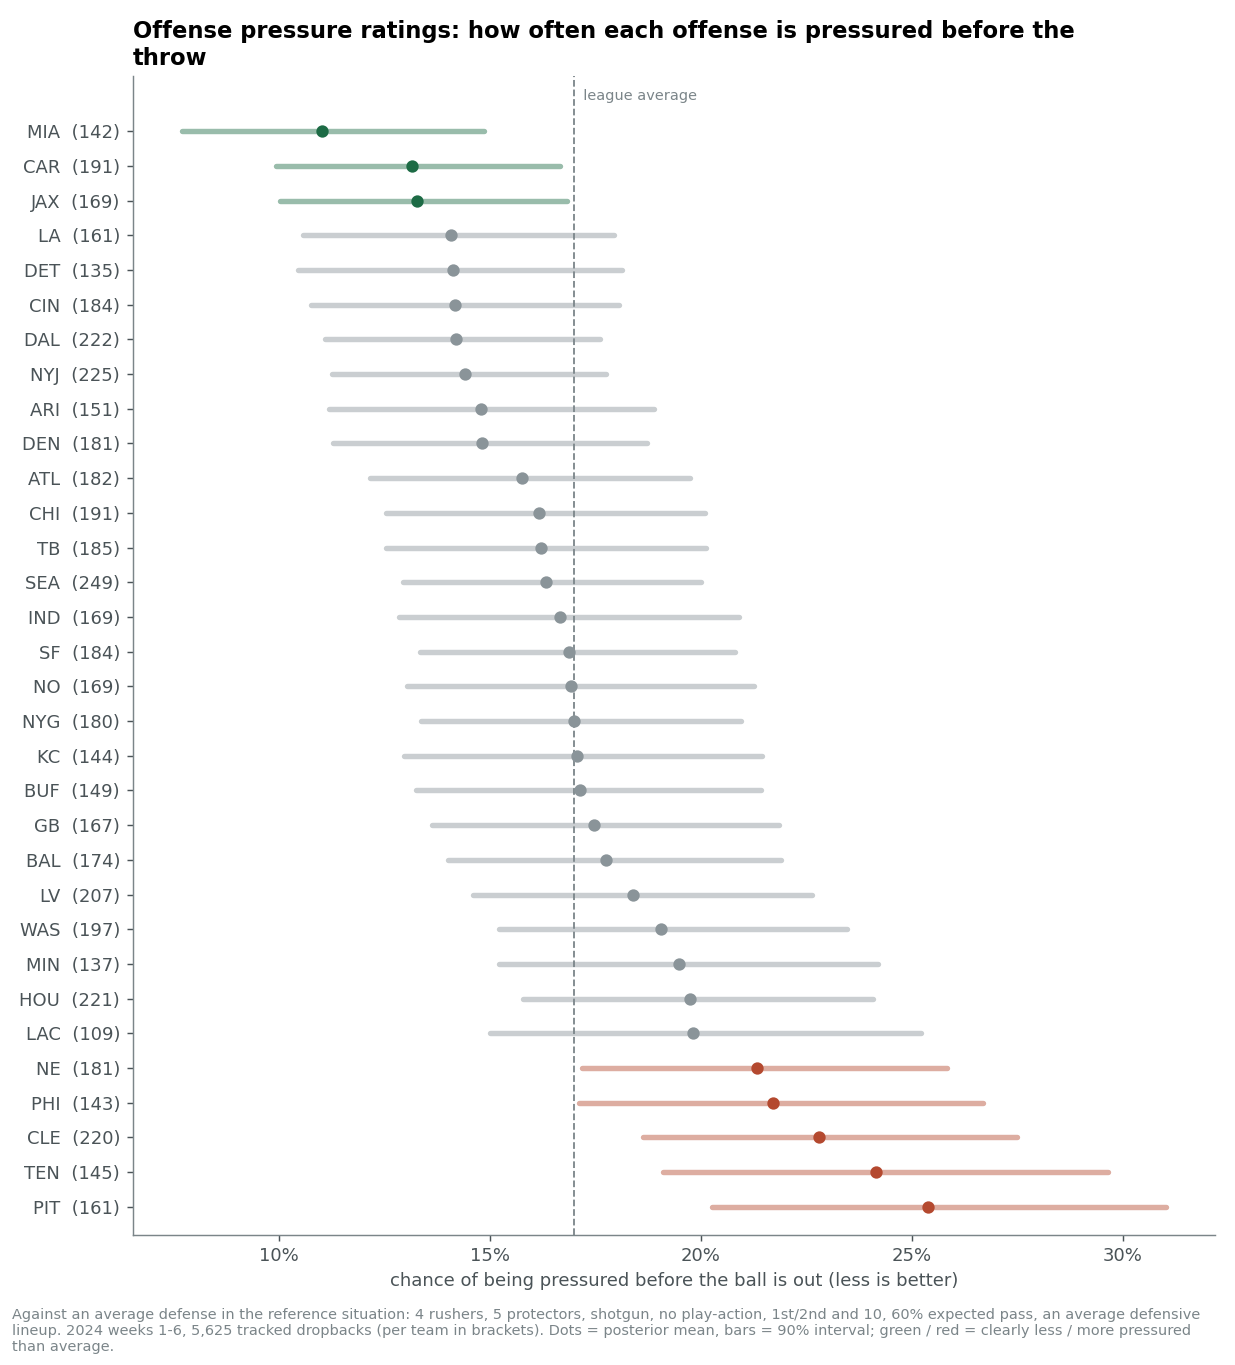
Against an average defense in our standard dropback, an average offense is pressured before the throw on 17% of dropbacks. Miami (11%), Carolina (13%) and Jacksonville (13%) are clearly below that; Pittsburgh (25%), Tennessee (24%), Cleveland (23%), Philadelphia (22%) and New England (21%) are clearly above. The wide intervals are honest: most offenses can't yet be separated from average.
This ranking and the line ranking disagree more than they agree. Washington ranks 2nd by space and 24th by pressure; Philadelphia 8th and 29th; Baltimore 3rd and 22nd. Carolina goes the other way, 21st by space and 2nd by pressure.
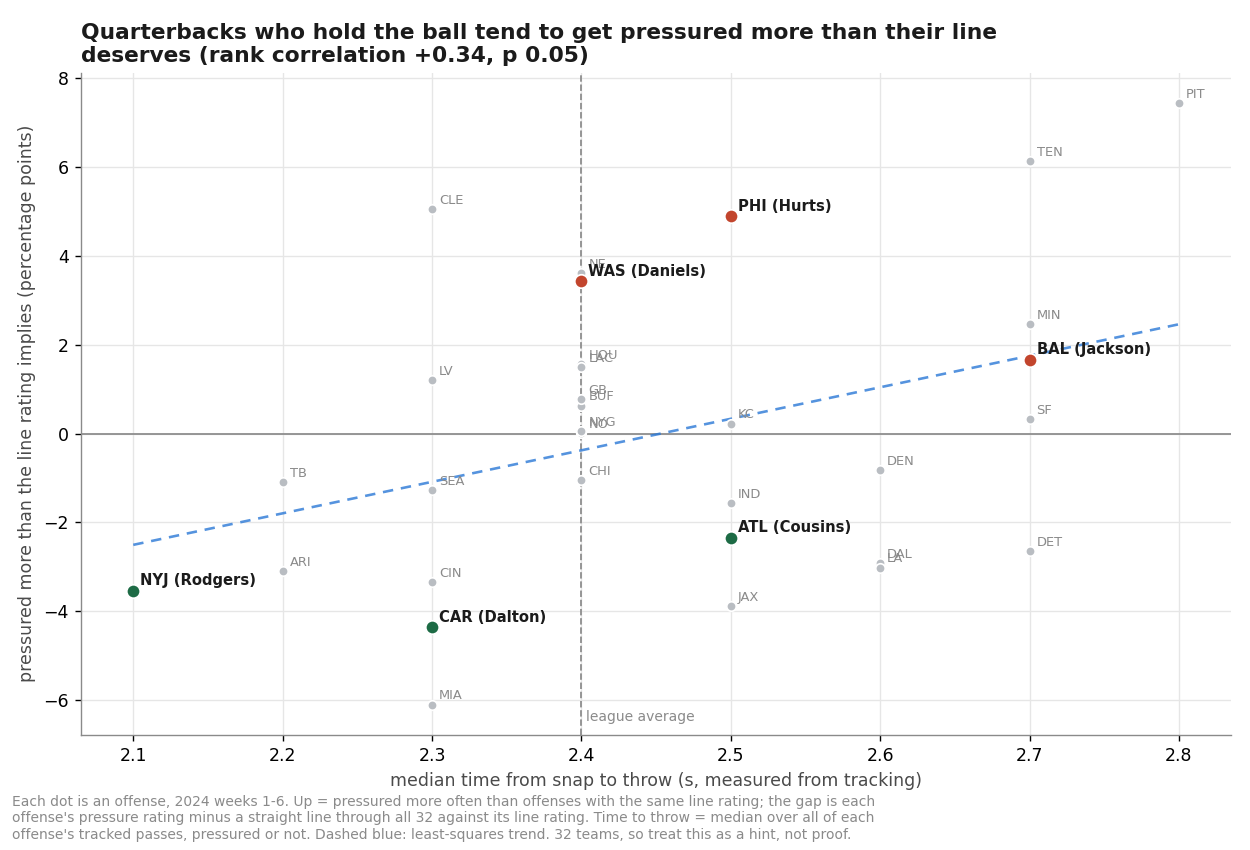
Is the gap the quarterback? Largely, it seems. Offenses whose quarterbacks hold the ball longer tend to be pressured more than their line rating implies (rank correlation 0.34 across the 32 offenses, p = 0.05). Rodgers' Jets release fastest in the league, at a median 2.1 seconds, and sit well below the trend; Jackson's Ravens release at 2.7 seconds and sit above it. But it is not the whole story: Washington releases at the league median, 2.4 seconds, and is still pressured more than its line implies, and Cousins' Falcons are slower than average yet pressured less.
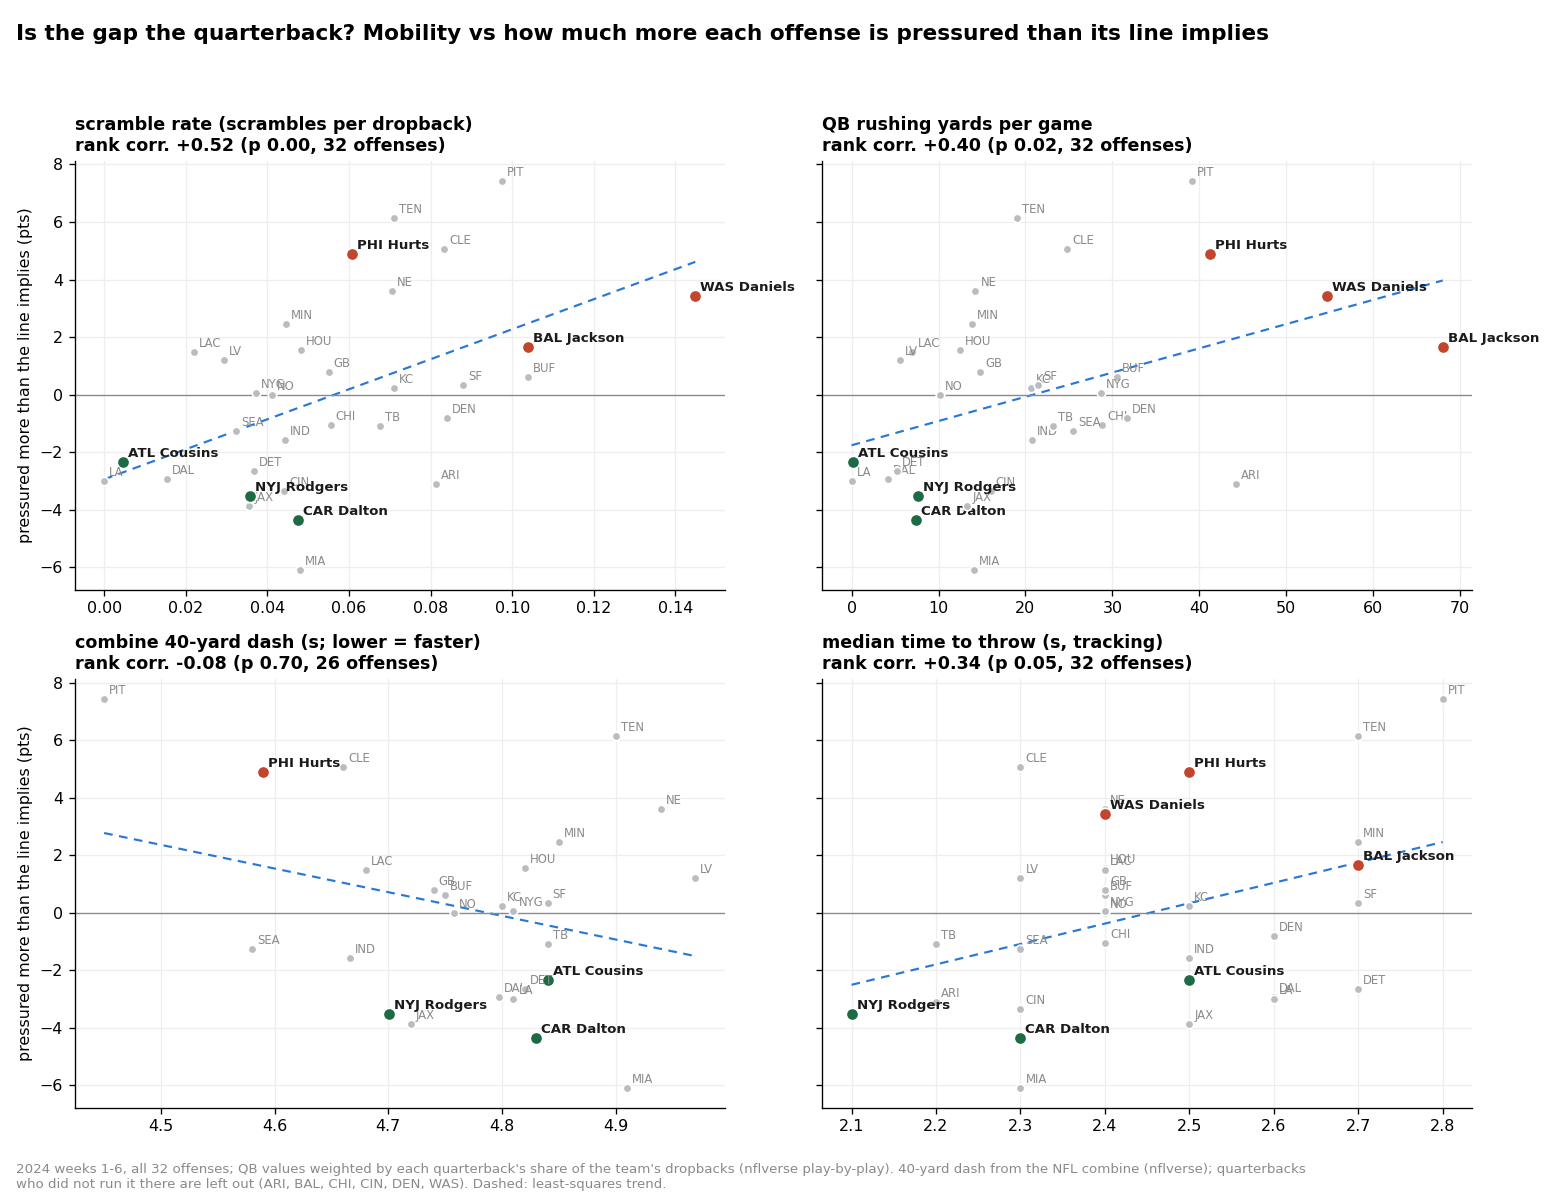
Holding the ball is only half of it. The stronger link is mobility. Offenses whose quarterbacks scramble more often are pressured more than their line implies (rank correlation 0.52, p = 0.003), and the same goes, a little more weakly, for quarterback rushing yards (0.40). Justin Fields, Jalen Hurts, Jayden Daniels and Lamar Jackson all scramble or run a lot and all sit above the line; Kirk Cousins, Matthew Stafford, Jared Goff and Aaron Rodgers barely run and all sit below it. Scrambling and holding the ball are nearly separate habits (correlation 0.11), and each adds to the gap.
Isn't a pressured quarterback simply forced to scramble? Partly, which is why we also checked each quarterback's scramble rate from 2023, before any of this season's pressure: it still predicts this season's gap (0.43, p = 0.03, 24 offenses with a 2023 starter). Raw speed doesn't: the combine 40-yard dash shows no link at all, though several of the most mobile quarterbacks, Jackson and Daniels among them, never ran it there. A mobile quarterback extends plays, and an extended play gives the rush more time to arrive.
Defenses: the pass rush is its players
Defenses were harder. Their results in one week barely predicted the next. What did predict it was the people on the field: add up each defender's sacks and QB hits per snap, over last season and this one so far, weighted by how much he plays.
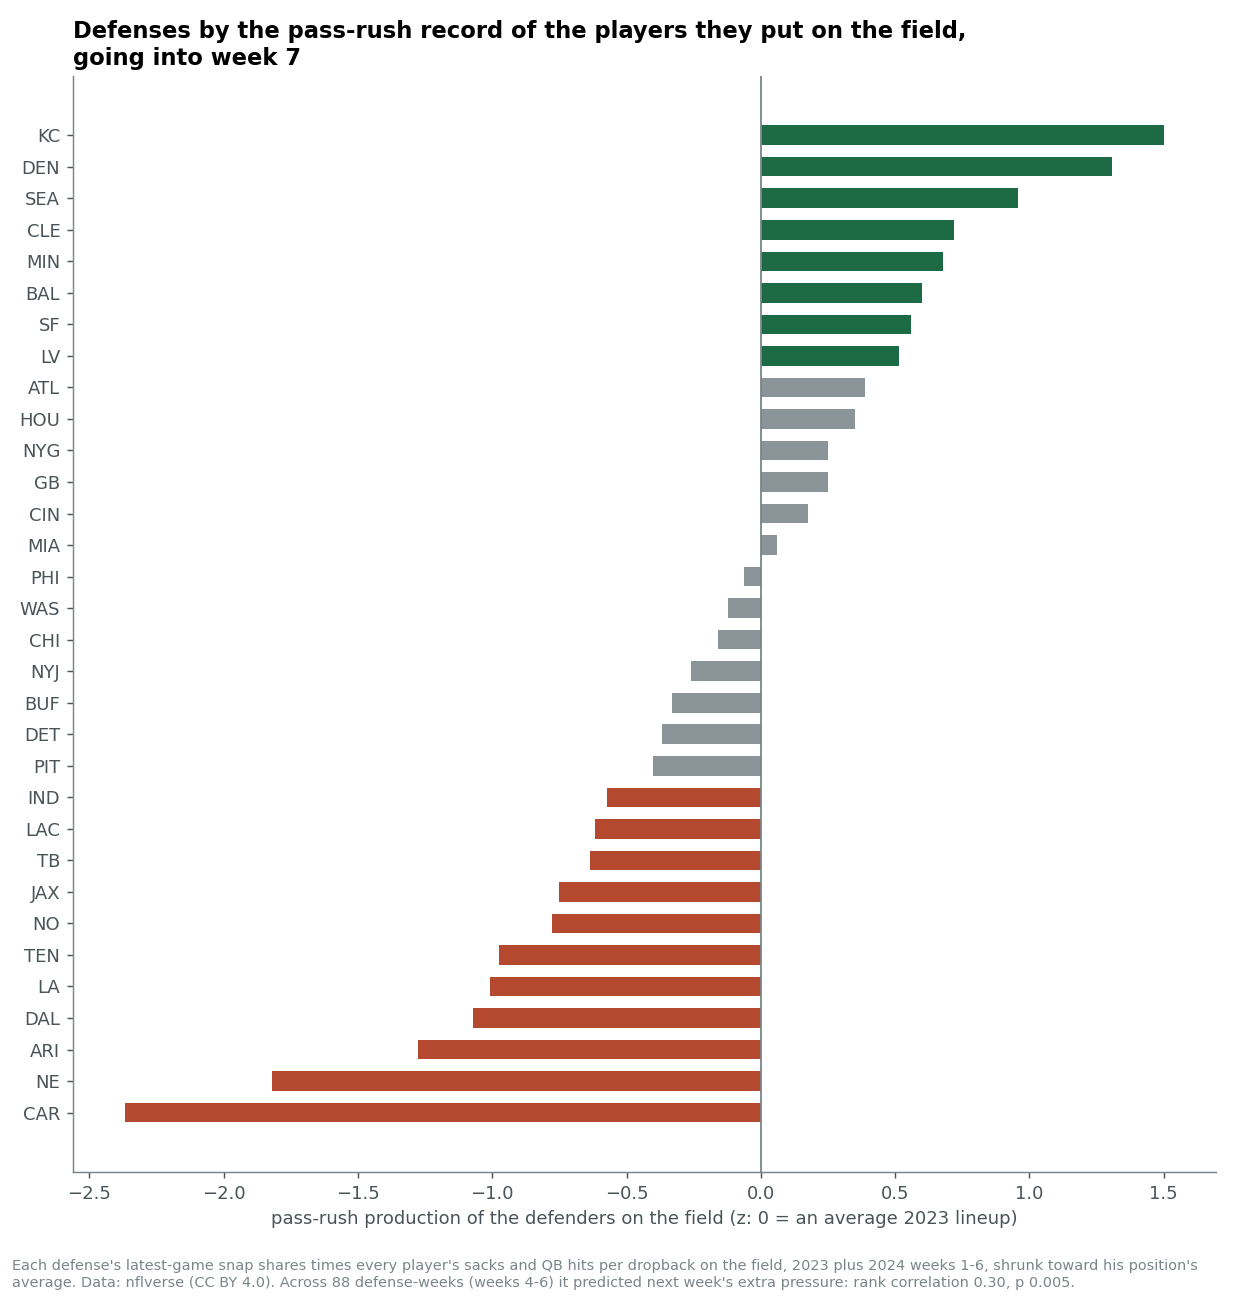
Going into week 7, Kansas City and Denver put the most productive pass rushers on the field, followed by Seattle and Cleveland. Carolina, New England and Arizona put the least.
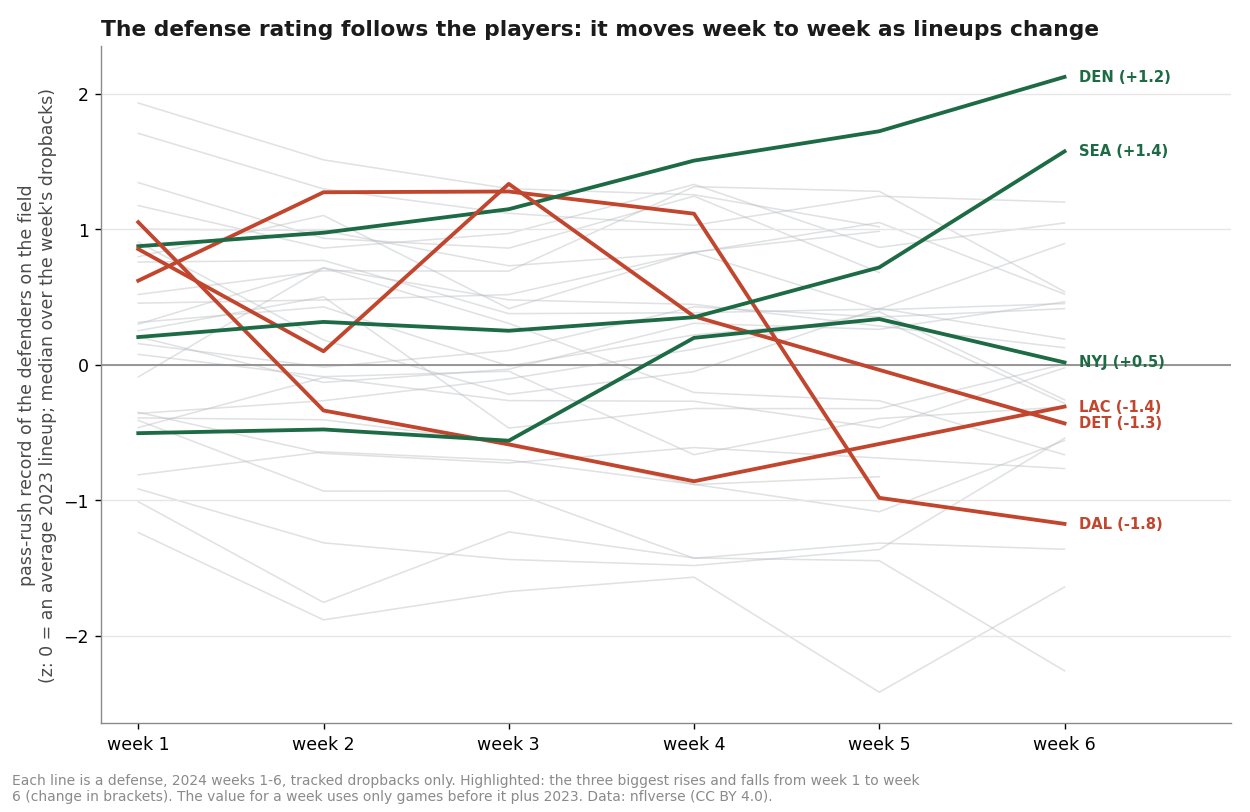
Because the rating is built from the players, it moves with the depth chart. Dallas ranked 3rd to 6th by this measure in weeks 2 to 4. Micah Parsons and DeMarcus Lawrence were both hurt in week 4 and missed the next two games, and Dallas fell to 23rd and then 25th. The Chargers ranked 5th in week 1, then fell to 24th to 26th as Joey Bosa played less and then not at all. Detroit's number dropped when Aidan Hutchinson was hurt during week 6.
Offenses don't adjust to a scary pass rush
If a defense's pass rush is mostly its players, offenses facing a good one should change their plan: keep a back in to block, use more play-action, get the ball out faster. Comparing each offense with itself, against scarier and milder fronts, they barely do. Those defenses still get home more often.
The deep dive
What we measured
We tracked every pass play we could from the 2024 regular season, weeks 1 to 6: 6,408 dropbacks, of which 5,625 passed every quality check. For each one we know where all 22 players are, 10 times a second, plus the snap, the throw and the play's outcome. About 5 to 7% of plays fail tracking and are left out. Excluded passes are slightly more likely to involve a sack or QB hit (10.7% against 9.3%), so the data leans a little toward cleaner pockets.
Two models
The rusher-distance model (the line rating). For each dropback, the log of the nearest rusher's distance follows a curve over time: a league baseline with a bend at 2.5 seconds, plus the situation, plus a level and a slope for the offense and for the defense. Measurements a tenth of a second apart are strongly related, so the residuals follow a first-order autoregressive process (ρ ≈ 0.97). Each play also gets its own random offset. The team effects are ZeroSumNormal, so zero is the league average.
The pressure-vs-throw model (the pressure rating). Every tenth of a second, a dropback can end in pressure, a throw, or something else (a scramble or a broken play). We model the three as competing risks with a discrete-time multinomial logit. Offense and defense each get a pressure and a throw effect, correlated through an LKJ prior. Adding up the step probabilities gives each offense's chance of being pressured before the ball is out, and its expected time to throw.
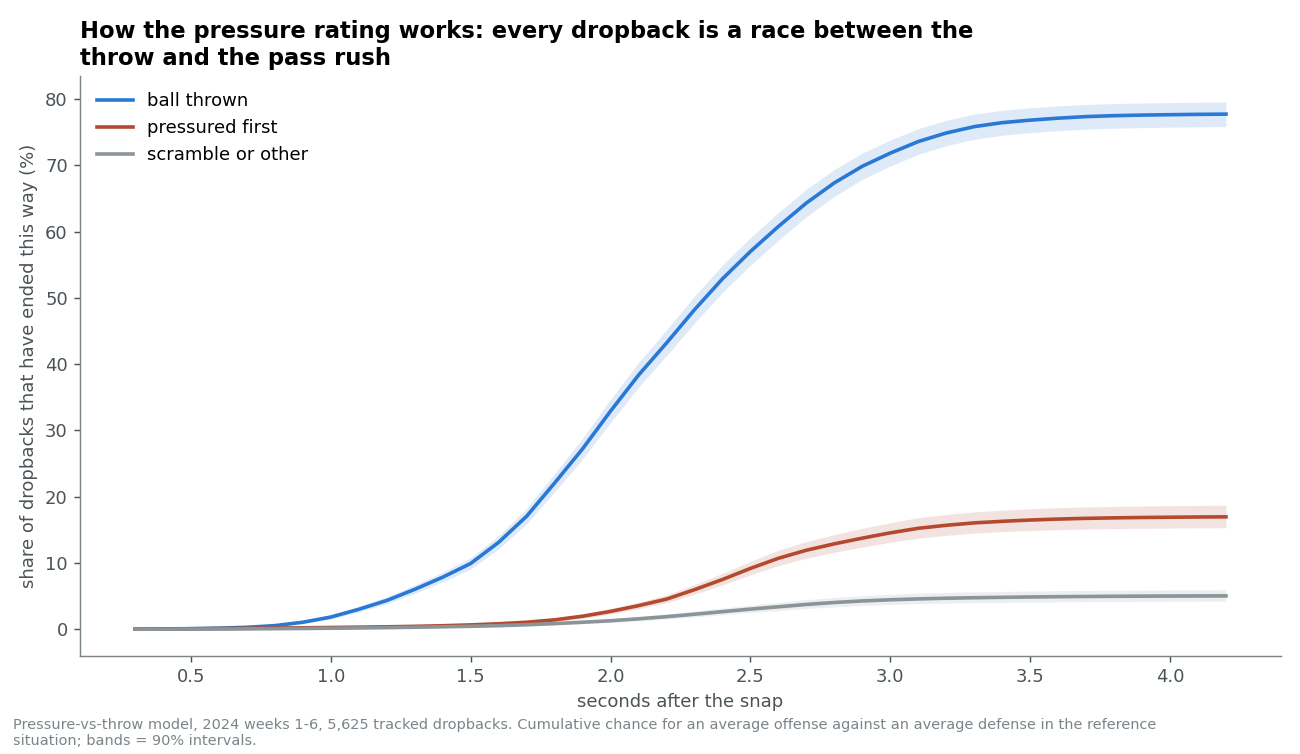
Both models condition on the situation (next section). Both were fit in PyMC with the nutpie sampler: 4 chains and 2,000 draws each. Convergence: the worst r-hat was 1.000 for the rusher-distance model and 1.006 for the pressure-vs-throw model, the smallest tail effective sample sizes were 3,653 and 1,091, and neither had a divergent transition.
Defense effects are held tight on purpose. In every test, the team-specific defense effects did not repeat from one week to the next. Their prior SD is 0.01 on the log-distance scale and 0.05 on the logit scale, so a defense's rating comes mostly from its personnel (below) unless the tracking data insists.
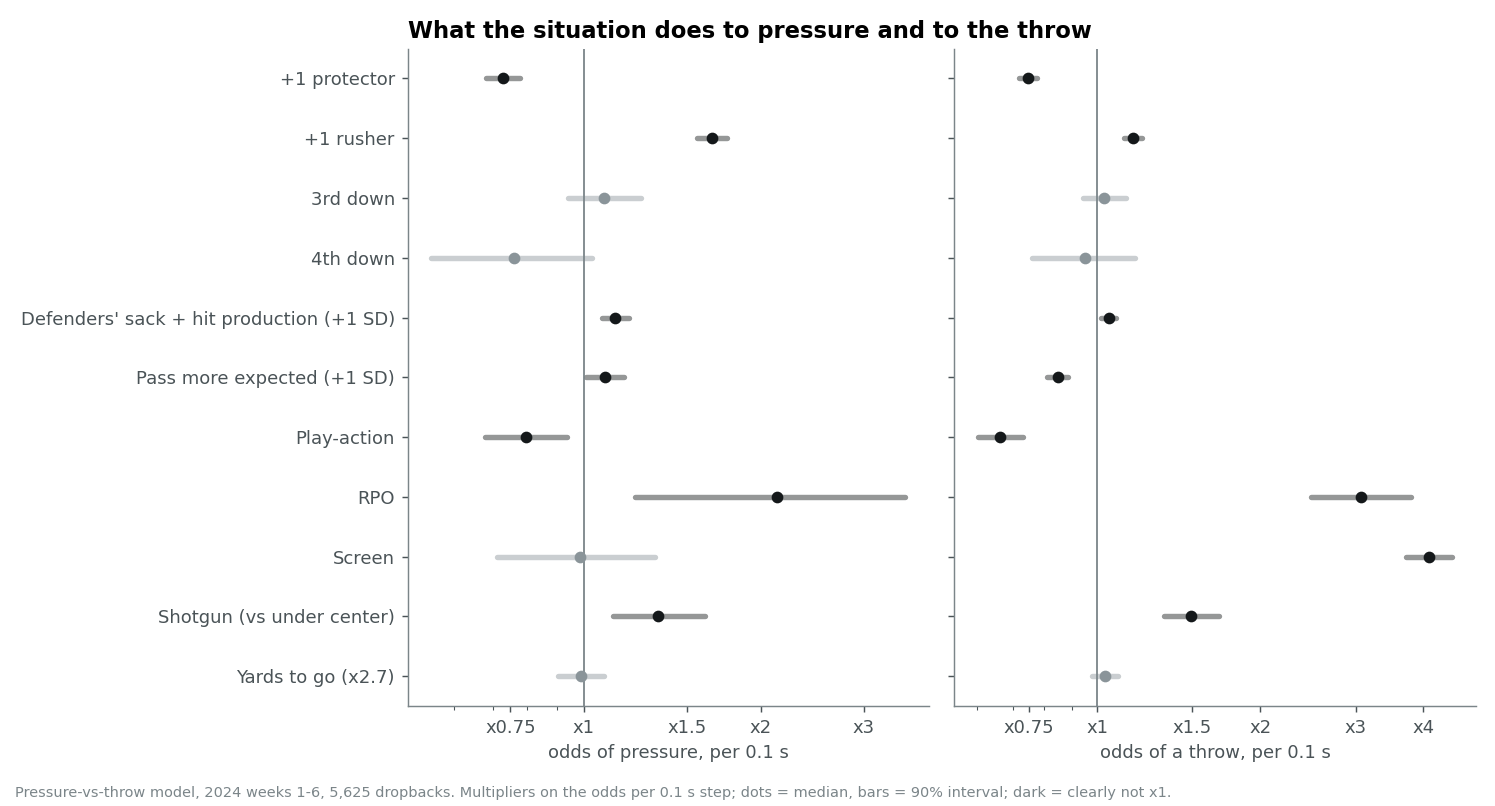
What the situation does
| Factor | Pressure odds (per 0.1 s) | Throw odds (per 0.1 s) | Rusher distance at 2.0 s |
|---|---|---|---|
| +1 rusher | ×1.65 (1.56–1.75) | ×1.17 (1.12–1.21) | −10% (−11% to −10%) |
| +1 protector | ×0.73 (0.68–0.78) | ×0.75 (0.72–0.77) | +7% (+6% to +8%) |
| Play-action | ×0.80 (0.68–0.94) | ×0.66 (0.60–0.73) | +9% (+7% to +11%) |
| Shotgun (vs under center) | ×1.34 (1.12–1.61) | ×1.49 (1.33–1.68) | +10% (+7% to +12%) |
| Screen | ×0.98 (0.71–1.32) | ×4.09 (3.71–4.51) | −1% (−3% to +2%) |
| RPO | ×2.13 (1.22–3.52) | ×3.07 (2.48–3.79) | −14% (−18% to −9%) |
| 3rd down | ×1.08 (0.94–1.25) | ×1.03 (0.94–1.13) | 0% (−2% to +1%) |
| 4th down | ×0.76 (0.55–1.03) | ×0.95 (0.76–1.18) | +5% (+1% to +10%) |
| Yards to go (×2.7) | ×0.99 (0.90–1.08) | ×1.03 (0.98–1.09) | 0% (−1% to +1%) |
| Pass more expected (+1 SD) | ×1.09 (1.01–1.17) | ×0.85 (0.81–0.89) | −2% (−3% to −1%) |
| Defenders' sack + hit record (+1 SD) | ×1.13 (1.07–1.19) | ×1.05 (1.02–1.08) | −2% (−3% to −2%) |
Medians with 90% intervals. Odds multipliers below 1 mean less pressure (or a later throw); the distance column is the change in the nearest rusher's distance at 2.0 seconds.
Two of these inputs are our own:
- How expected a pass was. nflverse's expected-pass probability uses a win probability that includes the pre-game betting spread, which would bring team strength into the situation. We refitted the same idea without the spread: a gradient-boosted model of "was this a dropback?" trained on the 2016-2023 seasons, using down, distance, field position, quarter, time left, score and plain win probability. It predicts 2024 as well as nflverse's version (log loss 0.527 against 0.531).
- The defenders' pass-rush record. For each defender, sacks (half for a shared one) plus QB hits on non-sack plays, per dropback he was on the field for. We use last season plus every earlier week of this one, shrunk toward his position's average over 150 dropbacks. A play's value is the sum over the 11 defenders on the field. This season's dropbacks on the field are estimated from snap counts, because nflverse publishes who was on the field for each play only after a season ends. For 2024, the estimate matched the exact version at r = 0.9996.
Do the ratings hold up?
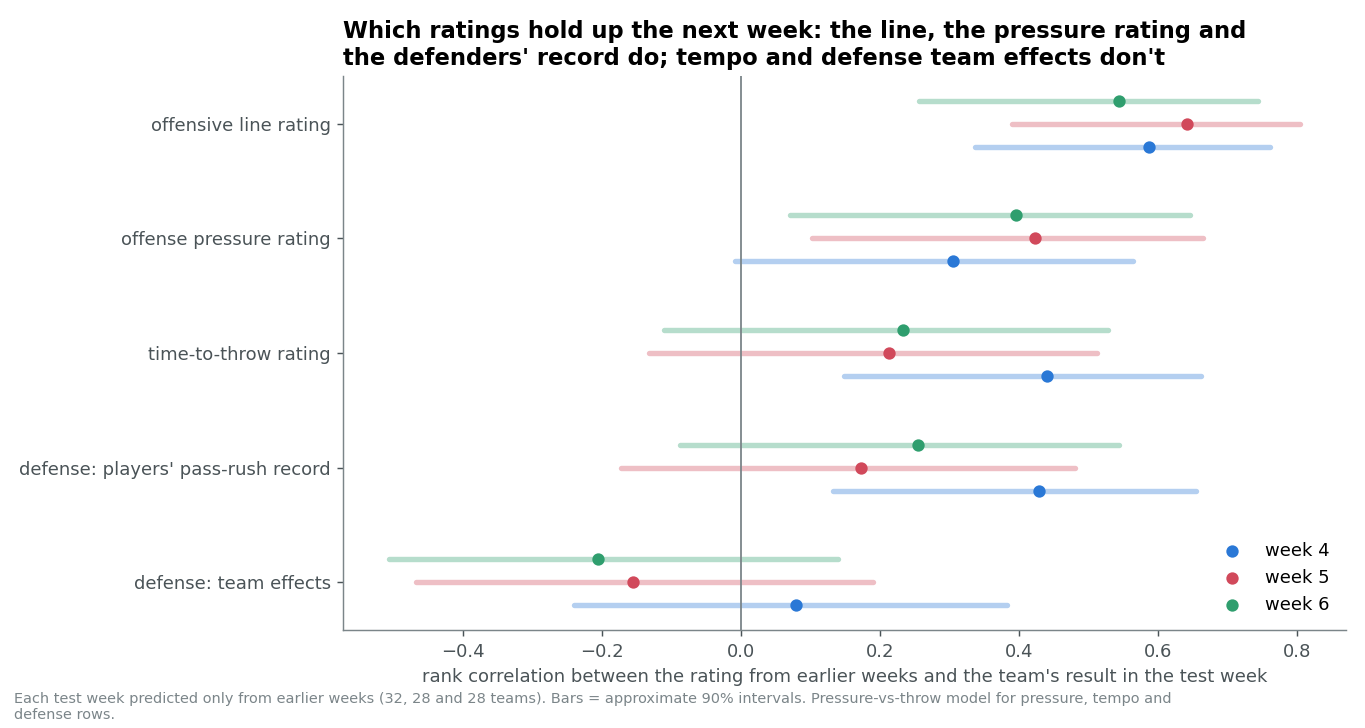
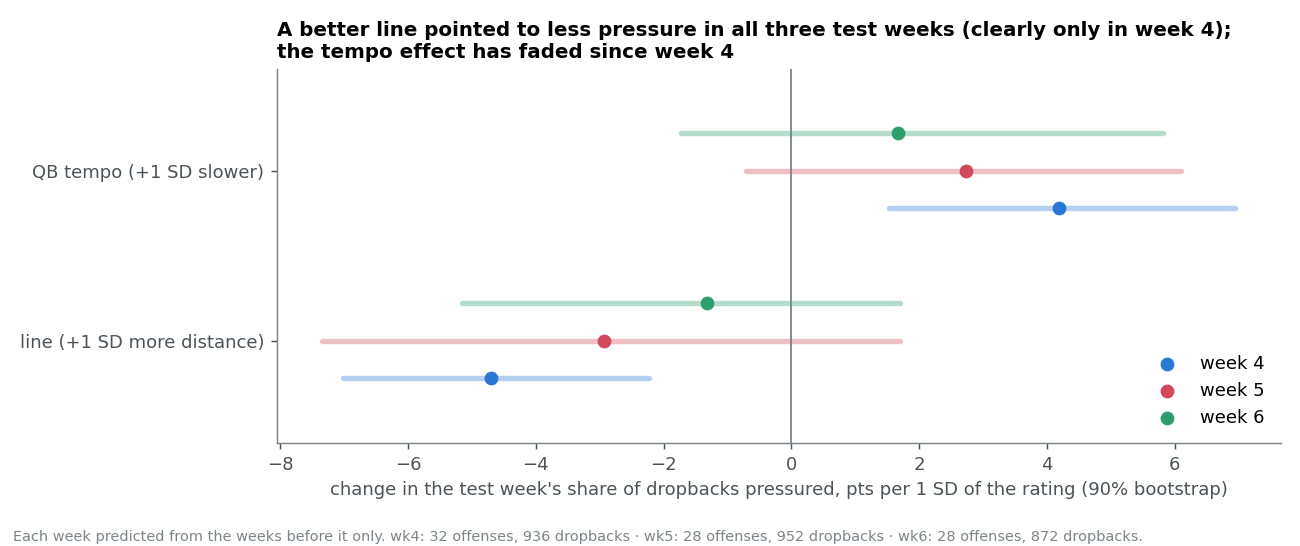
We checked each version on games it had not seen: trained on weeks 1-3 and tested on week 4, then 1-4 on week 5, then 1-5 on week 6.
| Check | Week 4 | Week 5 | Week 6 |
|---|---|---|---|
| Offensive line rating repeats (rank correlation) | 0.59 | 0.64 | 0.54 |
| Offense pressure rating repeats | 0.31 | 0.42 | 0.40 |
| Time-to-throw rating repeats | 0.44 | 0.21 | 0.23 |
| Line + tempo explain next week's pressure share | 22% | 5% | 2% |
| Defenders' record predicts the defense (two models) | 0.17 · 0.43 | 0.26 · 0.17 | 0.57 · 0.26 |
Pooled over the three weeks, the defenders' record predicts a defense's extra pressure at a rank correlation of 0.30 in both models (p ≤ 0.005, 88 defense-weeks). The defenses' own team effects did not: 0.13 and −0.07.
What didn't hold up
- Quarterback tempo. Each offense's time-to-throw rating repeated in week 4 and not since. We report it in the data, but we don't rank on it.
- Defense team effects. Defenses look different within the training weeks, but those differences don't carry into the next week. Personnel does.
- Box count and personnel groupings. They explain how many rushers a defense sends, but add nothing once the rushers and protectors are known.
- Week-to-week pressure share. One game is about 30 dropbacks, so a team's observed pressure rate in a single week is mostly noise. That is why line + tempo explained 22% in week 4 but only 2% in week 6.
A follow-up: the run game freezes the rush, on play-action
A defense facing a dangerous running game should rush the passer more cautiously, and that would flatter the offense's line and understate the defense. We checked. Measuring each offense's run game by designed-run EPA per carry (last season plus this season's earlier games), a better run game does not lower pressure on ordinary dropbacks once the line itself is accounted for: good running teams tend to have good lines (correlation 0.47). On play-action, it does. Each standard deviation of run strength cuts the odds of pressure on a play-action dropback by about 14%, a clear difference from ordinary dropbacks (the 90% interval of the difference excludes zero), and rushers close slightly faster in the first half-second, as if attacking the fake rather than the quarterback. The next version of both models will carry run strength and its interaction with play-action, so a defense isn't marked down for facing play-action from a team it has to respect.
Limits
- The offense rating is the line and the quarterback together: how the quarterback drops and climbs the pocket is part of it. Separating the five linemen needs blocker-by-blocker matchups.
- Six weeks is not a season. The intervals are wide, and many teams can't be told apart from average.
- The curve after about 2.5 seconds rests on few plays, which is why the line rating is taken at 2.5 seconds.
- About 5-7% of plays fail tracking and are left out.
Next, we're adding more weeks of tracking, which will tighten every interval here and let us separate more teams from average. Questions, or a team you want us to look at more closely? Send them our way.
Methods
Tracking: our own computer-vision pipeline on broadcast sideline video, 2024 regular season, weeks 1-6. Play-by-play, snap counts and player IDs: nflverse (CC BY 4.0). Models: Bayesian, fit in PyMC 5.12 with nutpie. Ratings are posterior means with 90% intervals, against an average opponent in a standard dropback: 4 rushers, 5 protectors, shotgun, no play-action, screen or RPO, 1st or 2nd and 10, a 60% expected pass, an average defensive lineup.
Cite this: Advanced Football Stats, "Pass Protection Ratings: Which Offensive Lines Buy Their Quarterback Time," October 16, 2026, https://advancedfootballstats.com/insights/nfl-pass-protection-ratings.