Mobile Quarterbacks Don't Get Rushed Faster. They Hold the Ball Longer.
Offenses with scrambling quarterbacks get pressured more than their offensive lines deserve. We measured why on 5,625 tracked dropbacks from weeks 1 to 6 of the 2024 season, and rebuilt the pressure rating without the quarterback's legs.
By Advanced Football StatsPublished
In our pass protection ratings, three offenses stood out for the wrong reason. Washington, Baltimore and Philadelphia had three of the eight best lines by space, and all three were pressured more often than average. The common thread was the quarterback: Jayden Daniels, Lamar Jackson and Jalen Hurts all extend plays with their legs. This post measures how that turns into pressure, and what the ratings look like once we account for it.
The short version
- The rush doesn't get there faster. Moment by moment, the chance of pressure is the same for a scrambler as for a pocket passer.
- The throw comes later. Each standard deviation of our scramble rating lowers the moment-to-moment chance of a throw by about 7% (90% interval 2% to 11%), so the rush has more time to arrive. That's the whole mechanism.
- Rushers are, if anything, a little farther away: about 1% more space at two seconds, though that interval just reaches zero.
- Scramblers don't freeze the rush either. Defenses send the same number of rushers, and those rushers reach the quarterback just as often, moment for moment.
- Net of the quarterback, the ratings move. Baltimore goes from 22nd to 9th in pressure rating, Pittsburgh, Washington and Philadelphia improve, and Atlanta, with Kirk Cousins, falls from 11th to 19th.
Who scrambles
Our scramble rating is a quarterback's scrambles per dropback, using last season plus this season so far, and pulled toward the league average for quarterbacks with few dropbacks, so a rookie starts at the league rate and earns his way off it.
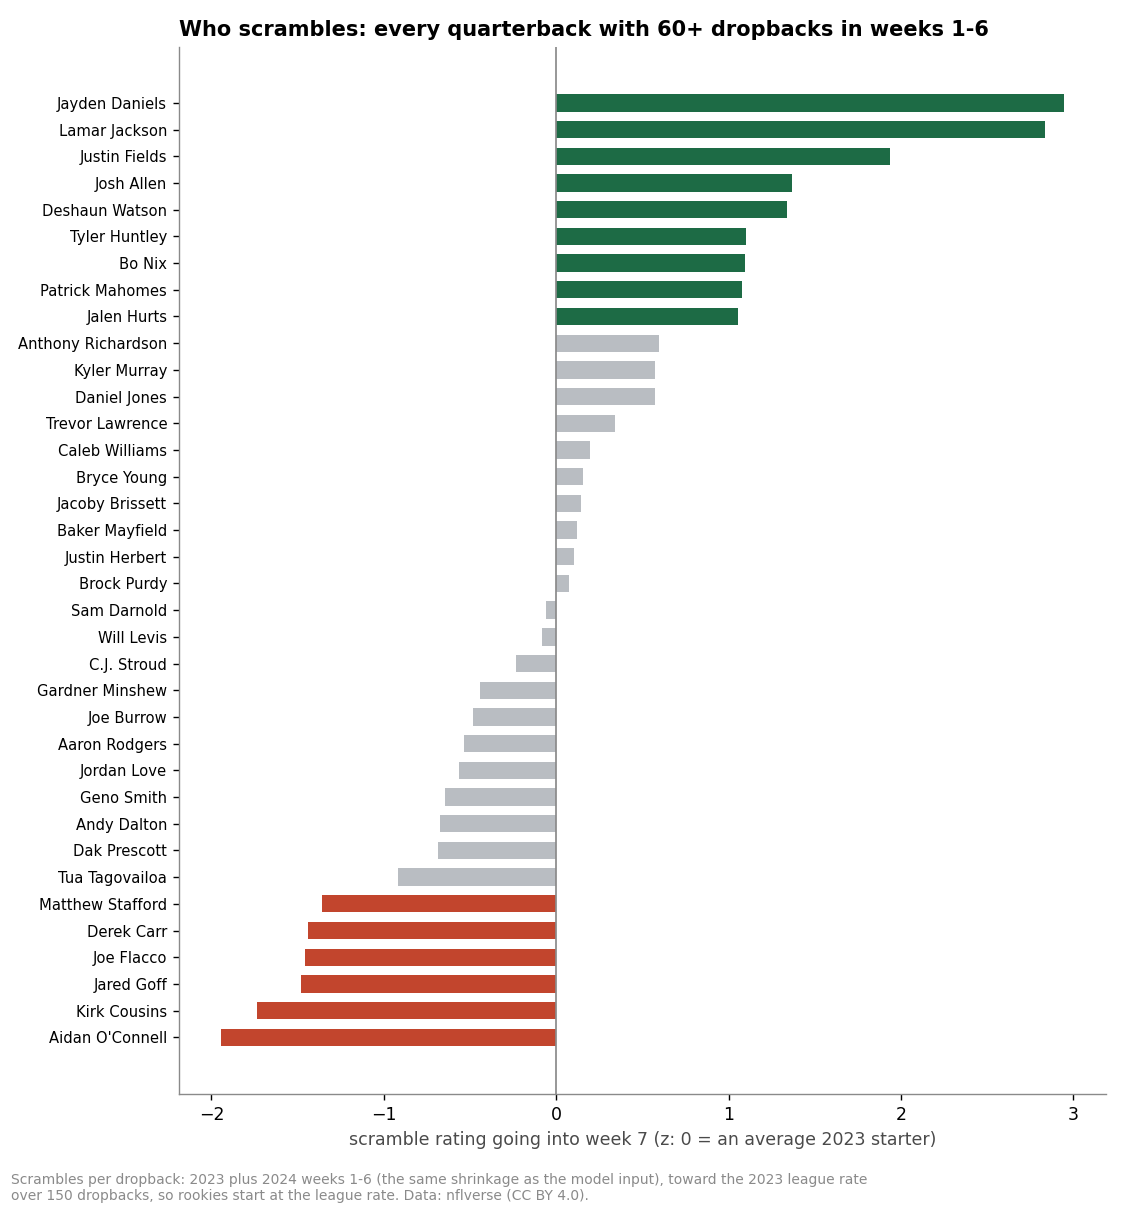
In our pass protection ratings, last season's scramble rate already predicted which offenses would be pressured more than their lines implied, and raw speed (the combine 40) did not. Mobility shows up in how a quarterback plays, not in a sprint time.
How mobility turns into pressure
We added the scramble rating to both of our models and fitted them on all 5,625 tracked dropbacks.
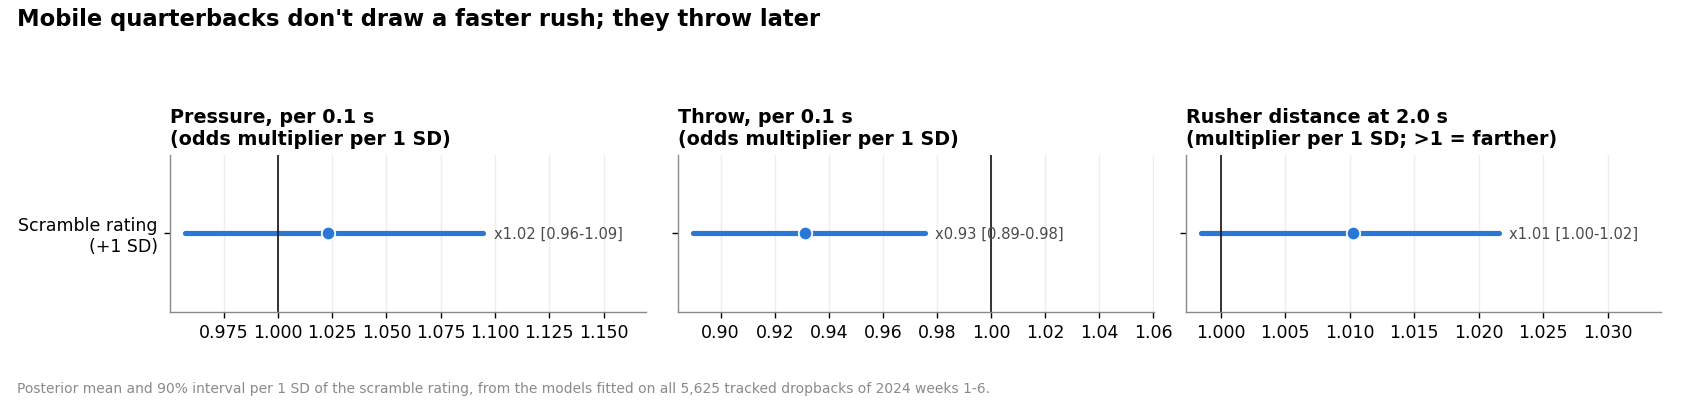
Every dropback is a race between the throw and the pass rush. A mobile quarterback doesn't make the rush faster; he slows his own side of the race, extending the play in search of something better. Over a longer play, the same moment-to-moment pressure adds up to more pressure before the ball is out.
That isn't necessarily a flaw. A quarterback who extends a play is looking for something better than the first read, and pressure counts only the cost of that search, not what it finds. Whether the trade pays off is a question for another post.
Don't scramblers freeze the rush?
The usual argument runs the other way: a quarterback who can run makes rushers play it safe. They stay in their lanes, don't overrun the pocket, and some defenders spy instead of rushing. If that were true, mobile quarterbacks should see fewer rushers, more space, or a slower rush, and their legs would be protecting their line, not exposing it.
We looked for each of those, and found none of them in a meaningful size:
- Rushers. Defenses send the same number of pass rushers against scramblers as against pocket passers.
- Space. Rushers are about 1% farther away at two seconds, and part of that comes from mobile quarterbacks dropping deeper, not from rushers holding back.
- Pace. Moment for moment, the chance of pressure doesn't fall as the scramble rating rises (1.02 per standard deviation, 90% interval 0.96 to 1.09).
There is one catch. Some of what counts as pressure is a flush: the quarterback leaves the pocket with a rusher closing in. About 40% of the raw pressure gap between scramblers and pocket passers is flushes, and a mobile quarterback may leave the pocket because he can, not because he has to. So we refit the model counting flushes as the quarterback's own choice rather than as pressure. The answer didn't change: per-moment pressure 0.99 (0.92 to 1.06), the throw still about 7% slower per moment, and scramblers no more likely to be flushed at any given moment. They're flushed more in total because their plays last longer.
That doesn't rule out a small freeze. The interval still allows for up to about 8% less pressure per moment. But nothing in six weeks of tracking points to one, and whatever freeze exists is far smaller than the extra time these quarterbacks spend holding the ball.
The pressure rating, net of the quarterback
Our original pressure rating measures the line and the quarterback together. With the scramble rating in the model, each offense's rating can be read at an average quarterback instead:
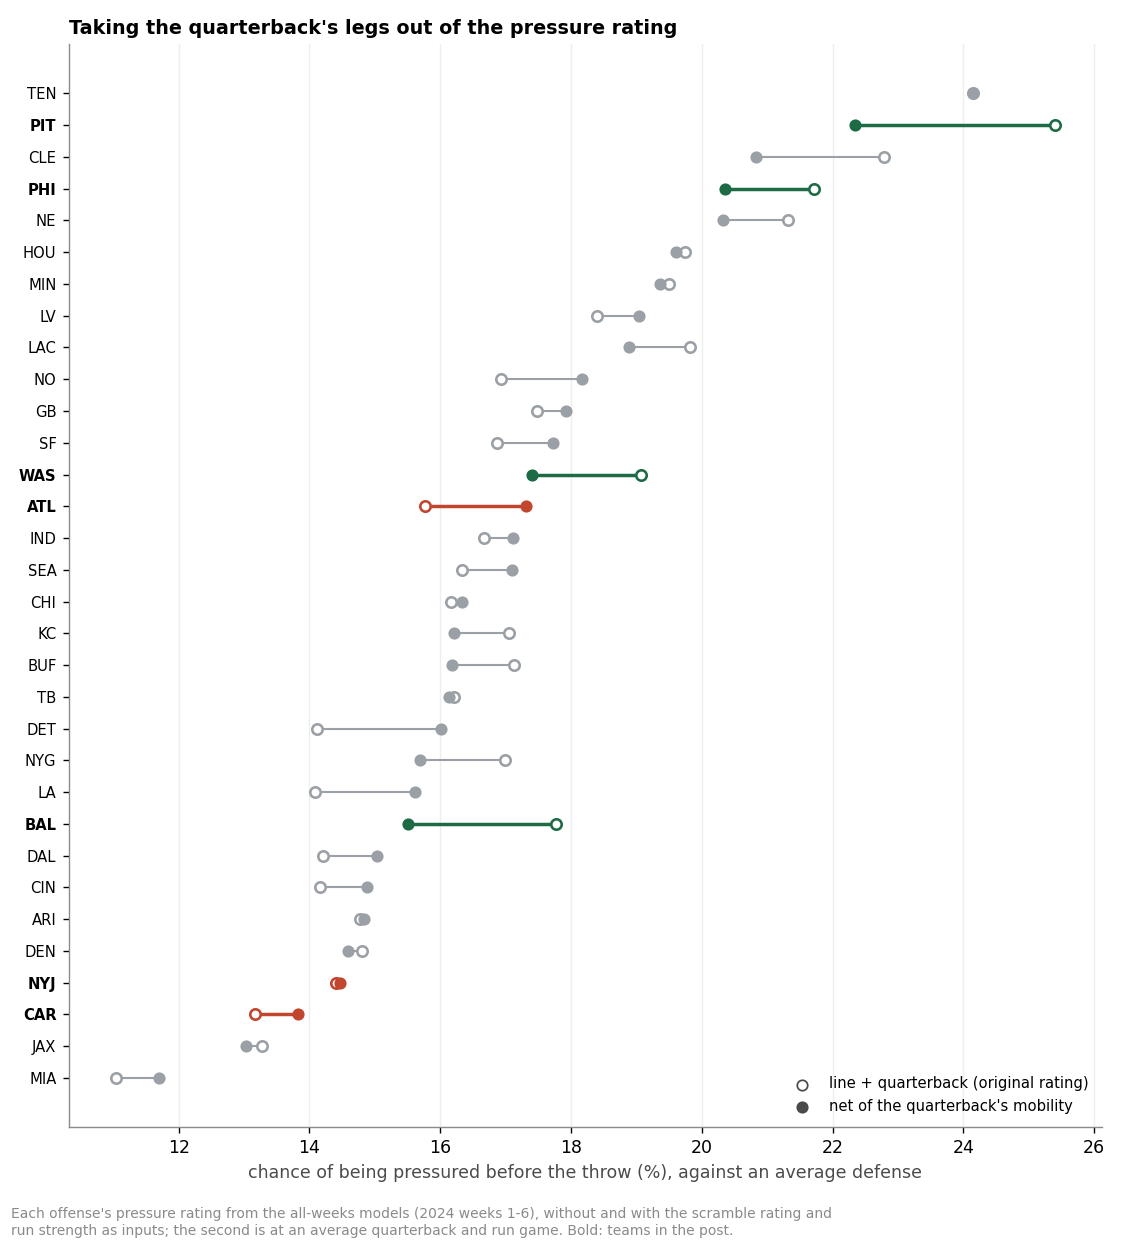
- Baltimore (Lamar Jackson): 17.8% → 15.5%, from 22nd to 9th.
- Pittsburgh (Justin Fields): 25.4% → 22.3%, the biggest change in the league.
- Washington (Jayden Daniels): 19.1% → 17.4%, from 24th to 20th.
- Philadelphia (Jalen Hurts): 21.7% → 20.3%.
- Atlanta (Kirk Cousins): 15.8% → 17.3%, from 11th to 19th. A quarterback who gets the ball out had been flattering his line.
Across all 32 offenses the order mostly holds (rank correlation 0.89 between the two versions); the teams that move are the ones at either end of the scramble rating. And with the quarterback taken out, the line rating and the pressure rating line up a little better than before (rank correlation 0.22, up from 0.11), though they still measure different things.
The deep dive
What we measured
The scramble rating counts nflverse scrambles per quarterback dropback: the 2023 season plus every 2024 game before the play's week, shrunk toward the 2023 league rate (about 5% of dropbacks) over 150 dropbacks, and standardized against 2023 starters. It's attached to each dropback through the quarterback who took it.
The models
The rusher-distance and pressure-versus-throw models from our pass protection ratings, with team effects for offense and defense and the same situation inputs, plus the scramble rating and the offense's run strength (the subject of a separate post). Fitted on all six weeks: 4 chains of 2,000 draws, worst r-hat 1.002 and 1.000, no divergent transitions. The refit with flushes counted as the quarterback's choice used the same settings (worst r-hat 1.004, no divergent transitions).
Does it predict better?
No. In fits on fewer weeks (weeks 1 to 3, 1 to 4 and 1 to 5), tested on the following week's games (2,760 dropbacks in 44 games), forecasts with and without the new inputs were the same within noise: −0.0002 log loss per dropback for the pressure model (90% interval −0.0027 to +0.0025), +0.0021 for the distance model (−0.0006 to +0.0048). The fits took the same time to run. We keep the scramble rating because it lets us separate the line from the quarterback, not because it predicts better.
Limits
- Net of the quarterback is still not the line alone. How a quarterback climbs or drifts in the pocket, how fast he reads the field, and the receivers getting open all remain in the offense's rating.
- What counts as pressure matters for the ratings. We count a flush as pressure, as in our pass protection ratings. If flushes count as the quarterback's own choice instead, the net-of-quarterback moves for scramblers shrink: Baltimore goes from 19th to 13th rather than 22nd to 9th, Washington from 23rd to 17th, and the overall order holds even more closely (rank correlation 0.92). The mechanism, a later throw with no faster rush, is the same either way.
- Rush lanes and spies aren't measured directly. Our check for a "frozen" rush is through rusher counts, distance and pressure rate, not through each rusher's path or assignment.
- Six weeks of 2024 tracking, so the intervals are wide.
- Scrambles are partly a reaction to pressure. That's why the rating uses only games before the play's week, and last season's rate.
Next, we're adding more weeks of tracking, which will tighten these intervals, and looking at the other side of the race: how quickly receivers get open. The run game's part in all this is in a separate post. Questions, or a quarterback you want us to look at more closely? Send them our way.
Methods
Tracking: our own computer-vision pipeline on broadcast sideline video, 2024 regular season, weeks 1-6. Play-by-play and player IDs: nflverse (CC BY 4.0). Models: Bayesian, fit in PyMC with nutpie.
Cite this: Advanced Football Stats, "Mobile Quarterbacks Don't Get Rushed Faster. They Hold the Ball Longer.," October 28, 2026, https://advancedfootballstats.com/insights/nfl-mobile-quarterbacks-pressure.