Does a Great Running Game Slow the Pass Rush?
A defense facing a dangerous running game should rush the passer more carefully. We measured it on 5,625 tracked dropbacks from weeks 1 to 6 of the 2024 season. It shows up clearly on play-action, and perhaps a little on every dropback.
By Advanced Football StatsPublished
There's an old coaching line: you have to stop the run to rush the passer. Turn it around and it becomes a question about offenses. Does a run game the defense has to respect buy the quarterback time? When we published our pass protection ratings, we promised to find out. This is the answer.
The short version
In plain terms: when defenses fear a team's running game, its play-action fakes work, and the quarterback gets pressured less often. On ordinary dropbacks, a good run game helps a little at most.
- Play-action: yes, clearly. The third of teams with the most dangerous run games were pressured on 15.6% of their play-action dropbacks, against 20.5% on their other dropbacks. The effect holds after we account for the offensive line, the quarterback and the situation. (In numbers: each step up in run strength cuts the odds of pressure at any moment of a play-action dropback by about 17%, with a 90% interval of 6% to 27%. One step is roughly the gap between a middle-of-the-pack run game like Seattle's and Washington's.)
- Ordinary dropbacks: maybe a little. The same comparison points the same way, but the effect is small and could be zero, so we can't call it yet. (About 7%; the interval runs from a 14% cut to a 1% increase.)
- It changes who gets the credit, not the forecasts. Knowing how good a team's run game is doesn't help predict next week's pressure. What it changes is the credit: some of the protection that looked like good blocking on play-action was really the threat of the run.
Which run games defenses have to respect
We measure an offense's run strength by its expected points added per designed run: how much, on average, each called running play improved the offense's chances of scoring (scrambles and kneel-downs left out). We use last season plus this season's earlier games, so the value a defense faces in week 7 uses only what happened before week 7.
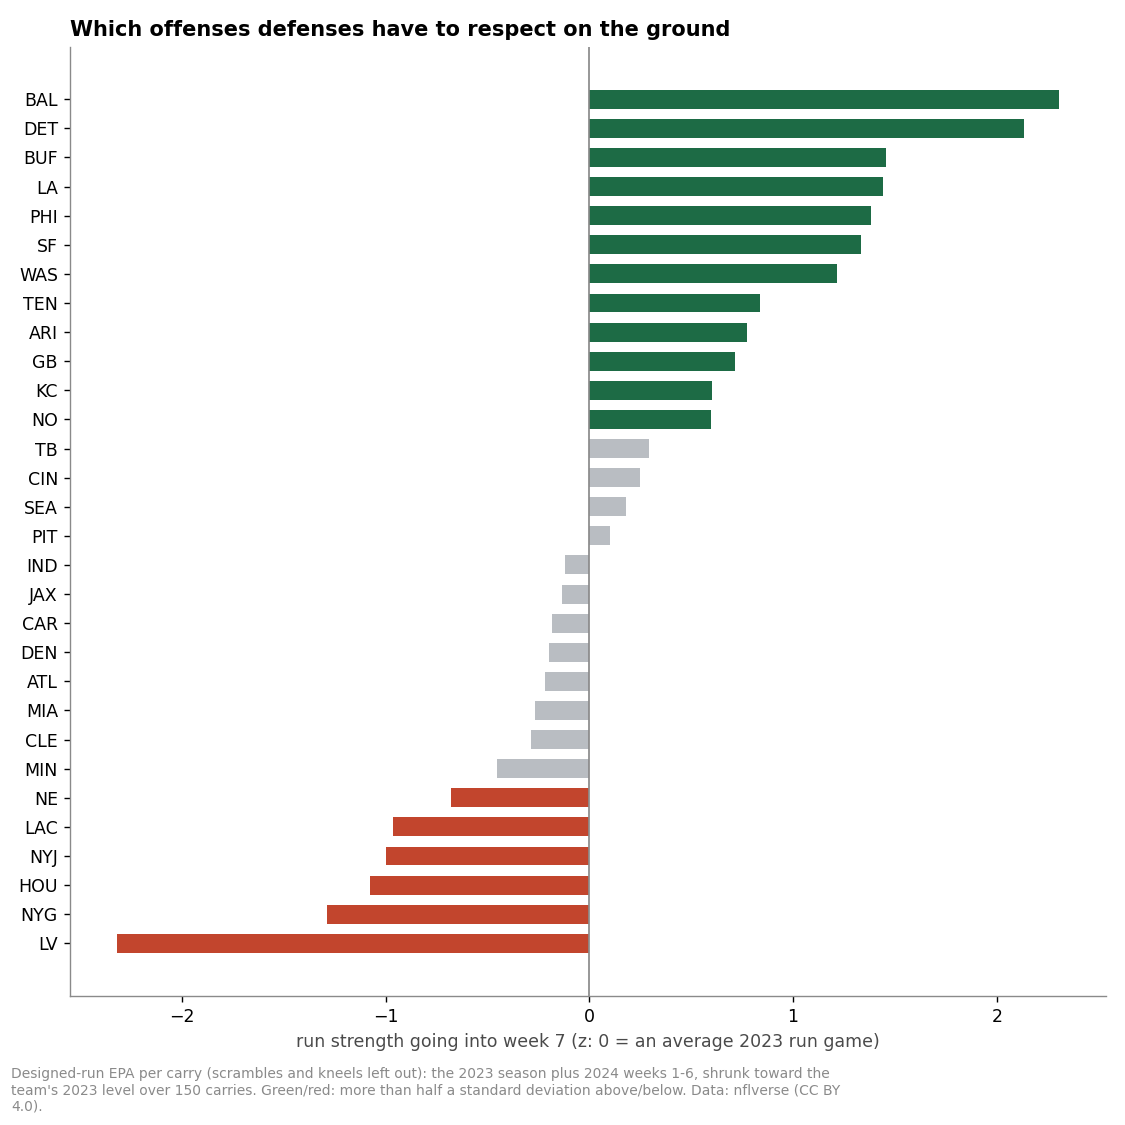
Baltimore's place at the top is no surprise: the league's best rushing offense in 2023 added Derrick Henry, with Lamar Jackson still a threat on every snap. Detroit is close behind with two backs, Jahmyr Gibbs and David Montgomery, who both have to be accounted for. At the other end, the Raiders, Giants and Texans gained the least per designed run.
What the raw numbers say
Split the dropbacks by how strong the offense's run game is, and by whether the play used play-action:
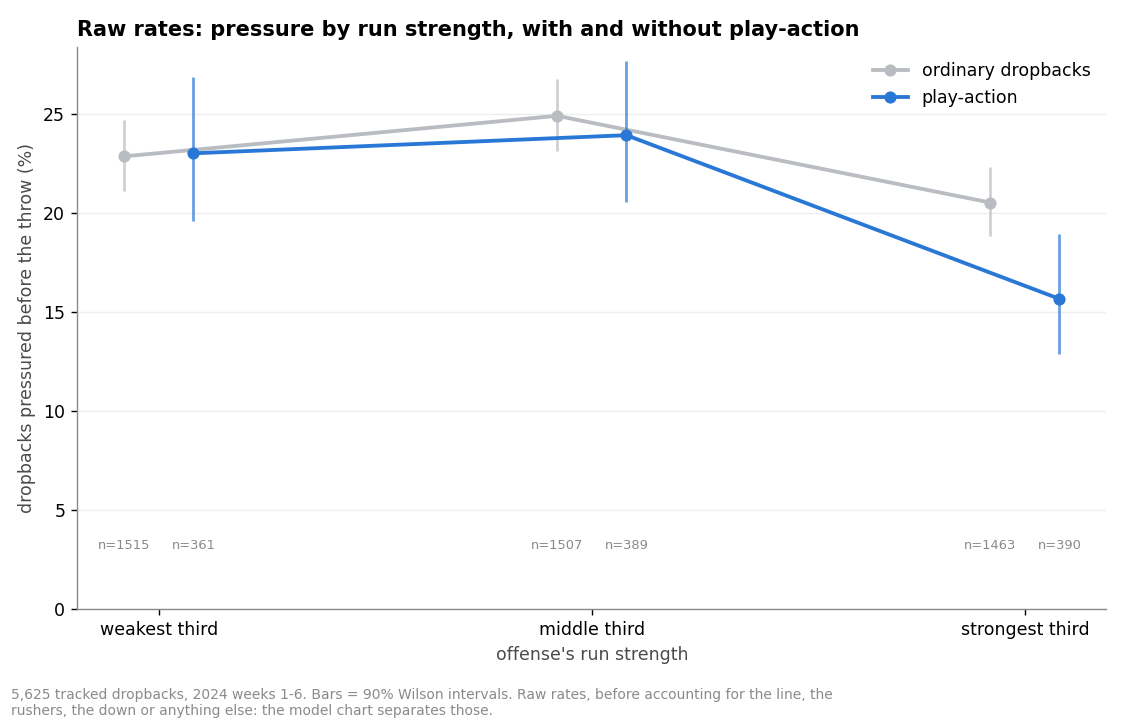
Play-action from the strongest third of running teams was pressured on 15.6% of dropbacks, against 20.5% for those teams' ordinary dropbacks and 23 to 25% for everyone else. For the weaker running teams, play-action made no difference at all.
In plain terms: a fake handoff only fools the rush if the rush believes it.
What the model says
The raw numbers mix the run game up with everything else, and strong running teams also tend to have good offensive lines (the two correlate at 0.47 across teams). So we added run strength, and its interaction with play-action, to both of our models, alongside the line, the quarterback and the full situation. That lets us ask: two teams with equally good lines, one with a feared run game and one without, does the first get pressured less?
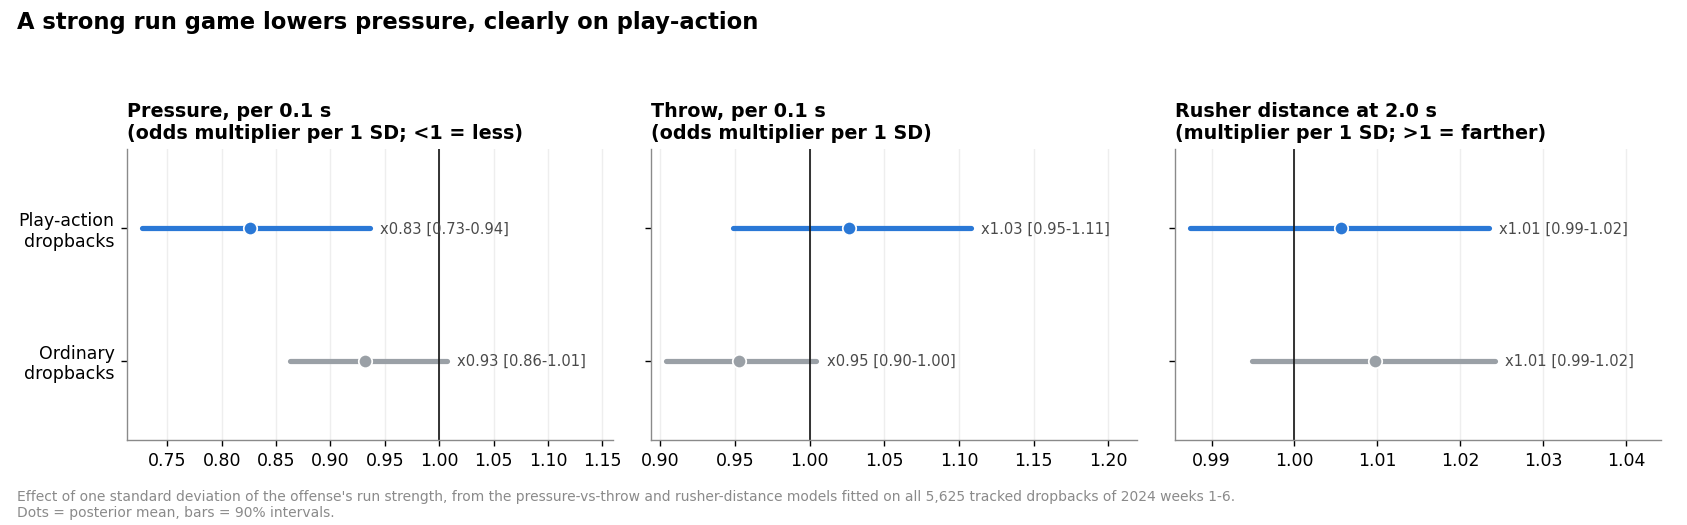
In plain terms: on play-action, yes, clearly. On everything else, probably a little. The details:
- Play-action: each standard deviation of run strength multiplies the odds of pressure, tenth of a second by tenth of a second, by about 0.83 (0.73 to 0.94). The model puts a 99.5% probability on it being a real reduction.
- Ordinary dropbacks: about 0.93 (0.86 to 1.01), a 93% probability of a real reduction. Likely, not established.
- Timing and space: on ordinary dropbacks the throw may also come a little later (odds 0.95, interval 0.90 to 1.00); on play-action there's no clear change. Rushers get no farther away on either. The run game shows up as fewer pressures, not as extra room.
A defense that has to respect the run has to honor the fake. Against a team it doesn't fear, the same fake buys nothing.
So part of what looks like good pass blocking on a play-action dropback is really the run game at work. In these models that part goes to the run game, and a line gets credit only for the protection it provides itself.
The deep dive
What we measured
Run strength is each offense's designed-run EPA per carry, from nflverse play-by-play: the 2023 season plus every 2024 game before the play's week, shrunk toward the offense's 2023 level over 150 carries. It's standardized against the 2023 spread of teams, so 0 is an average 2023 run game. The play-action term is run strength multiplied by whether the dropback used play-action.
The models
Both are the models behind our pass protection ratings: the rusher-distance trajectory model and the discrete-time pressure-versus-throw model, each with team effects for offense and defense and the same situation inputs (rushers, protectors, play-action, shotgun, screens, RPOs, down and distance, expected pass, and the defenders' pass-rush record). We added run strength, the play-action term and the quarterback's scramble rating (the subject of our next post) and fitted them on all six weeks: 4 chains of 2,000 draws, worst r-hat 1.002 and 1.000, no divergent transitions.
How sure are we?
Not very, on the split between play-action and everything else. When we fitted the same models on fewer weeks (weeks 1 to 3, 1 to 4 and 1 to 5), they put more of the effect on ordinary dropbacks and less on play-action. With all six weeks the balance tips toward play-action, which is also where the raw numbers point. Both readings agree that a strong run game lowers pressure; more weeks of tracking will settle where.
How this differs from our first look
Our pass protection ratings post reported a first check of this question: about a 14% cut in pressure odds on play-action, none on ordinary dropbacks, and rushers closing slightly faster in the first half-second of play-action. That check came before the final fit. The models here also carry the quarterback's scramble rating, and they're fitted on all six weeks. With those, the play-action effect is about 17% rather than 14%, ordinary dropbacks move from "none" to "perhaps a little", and the faster early closing no longer shows up clearly. The direction of the finding is the same; its size and where it shows up are what moved. The ratings in that post are unchanged: they come from the models without run strength.
Does it predict better?
No. In those fits on fewer weeks, tested on the following week's games (weeks 4, 5 and 6, 2,760 dropbacks in 44 games), the models with and without the new inputs forecast equally well: the difference in log loss per dropback was −0.0002 for the pressure model (90% interval −0.0027 to +0.0025) and +0.0021 for the distance model (−0.0006 to +0.0048). We keep run strength because it makes the ratings fairer to read, not because it makes them more accurate.
Limits
- Six weeks of 2024 tracking. The intervals are wide, and the split between play-action and other dropbacks moved between fits.
- Run strength is EPA per carry, which also reflects the line's run blocking; we can't fully separate "a scary run game" from "a good line".
Next, we're adding more weeks of tracking, which should settle how much of this belongs to play-action and how much to every dropback. The other follow-up from the ratings post, the quarterback's legs, comes next week. Questions, or a team you want us to look at more closely? Send them our way.
Methods
Tracking: our own computer-vision pipeline on broadcast sideline video, 2024 regular season, weeks 1-6. Play-by-play and player IDs: nflverse (CC BY 4.0). Models: Bayesian, fit in PyMC with nutpie.
Cite this: Advanced Football Stats, "Does a Great Running Game Slow the Pass Rush?," October 21, 2026, https://advancedfootballstats.com/insights/nfl-run-game-pass-rush.